The distribution of active RNA polymerase II along the transcribed region is gene-specific and controlled by elongation factors
- PMID: 20385590
- PMCID: PMC2919717
- DOI: 10.1093/nar/gkq215
The distribution of active RNA polymerase II along the transcribed region is gene-specific and controlled by elongation factors
Abstract
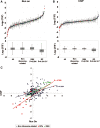
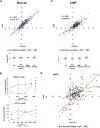
In order to study the intragenic profiles of active transcription, we determined the relative levels of active RNA polymerase II present at the 3'- and 5'-ends of 261 yeast genes by run-on. The results obtained indicate that the 3'/5' run-on ratio varies among the genes studied by over 12 log(2) units. This ratio seems to be an intrinsic characteristic of each transcriptional unit and does not significantly correlate with gene length, G + C content or level of expression. The correlation between the 3'/5' RNA polymerase II ratios measured by run-on and those obtained by chromatin immunoprecipitation is poor, although the genes encoding ribosomal proteins present exceptionally low ratios in both cases. We detected a subset of elongation-related factors that are important for maintaining the wild-type profiles of active transcription, including DSIF, Mediator, factors related to the methylation of histone H3-lysine 4, the Bur CDK and the RNA polymerase II subunit Rpb9. We conducted a more detailed investigation of the alterations caused by rpb9Delta to find that Rpb9 contributes to the intragenic profiles of active transcription by influencing the probability of arrest of RNA polymerase II.
Figures


Similar articles
-
Stimulation of RNA polymerase II transcript cleavage activity contributes to maintain transcriptional fidelity in yeast.Genes Cells. 2007 May;12(5):547-59. doi: 10.1111/j.1365-2443.2007.01072.x. Genes Cells. 2007. PMID: 17535246
-
RNA polymerase II subunit Rpb9 is important for transcriptional fidelity in vivo.Proc Natl Acad Sci U S A. 2006 Feb 28;103(9):3268-73. doi: 10.1073/pnas.0511330103. Epub 2006 Feb 21. Proc Natl Acad Sci U S A. 2006. PMID: 16492753 Free PMC article.
-
Transcription elongation factors repress transcription initiation from cryptic sites.Science. 2003 Aug 22;301(5636):1096-9. doi: 10.1126/science.1087374. Science. 2003. PMID: 12934008
-
The Rtt106 histone chaperone is functionally linked to transcription elongation and is involved in the regulation of spurious transcription from cryptic promoters in yeast.J Biol Chem. 2008 Oct 10;283(41):27350-27354. doi: 10.1074/jbc.C800147200. Epub 2008 Aug 15. J Biol Chem. 2008. PMID: 18708354
-
Single molecule transcription elongation.Methods. 2009 Aug;48(4):323-32. doi: 10.1016/j.ymeth.2009.04.021. Epub 2009 May 6. Methods. 2009. PMID: 19426807 Free PMC article. Review.
Cited by
-
Sub1 associates with Spt5 and influences RNA polymerase II transcription elongation rate.Mol Biol Cell. 2012 Nov;23(21):4297-312. doi: 10.1091/mbc.E12-04-0331. Epub 2012 Sep 12. Mol Biol Cell. 2012. PMID: 22973055 Free PMC article.
-
TFIIS is required for the balanced expression of the genes encoding ribosomal components under transcriptional stress.Nucleic Acids Res. 2012 Aug;40(14):6508-19. doi: 10.1093/nar/gks340. Epub 2012 Apr 27. Nucleic Acids Res. 2012. PMID: 22544605 Free PMC article.
-
Xrn1 influence on gene transcription results from the combination of general effects on elongating RNA pol II and gene-specific chromatin configuration.RNA Biol. 2021 Sep;18(9):1310-1323. doi: 10.1080/15476286.2020.1845504. Epub 2020 Dec 1. RNA Biol. 2021. PMID: 33138675 Free PMC article.
-
RNA polymerase II transcription elongation and Pol II CTD Ser2 phosphorylation: A tail of two kinases.Nucleus. 2014 May-Jun;5(3):224-36. doi: 10.4161/nucl.29347. Epub 2014 May 30. Nucleus. 2014. PMID: 24879308 Free PMC article. Review.
-
Basic mechanisms of RNA polymerase II activity and alteration of gene expression in Saccharomyces cerevisiae.Biochim Biophys Acta. 2013 Jan;1829(1):39-54. doi: 10.1016/j.bbagrm.2012.09.007. Epub 2012 Sep 26. Biochim Biophys Acta. 2013. PMID: 23022618 Free PMC article. Review.
References
-
- Price DH. Poised polymerases: on your mark…get set…go! Mol. Cell. 2008;30:7–10. - PubMed
-
- Hecht A, Grunstein M. Mapping DNA interaction sites of chromosomal proteins using immunoprecipitation and polymerase chain reaction. Methods Enzymol. 1999;304:399–414. - PubMed
-
- Hecht A, Strahl-Bolsinger S, Grunstein M. Mapping DNA interaction sites of chromosomal proteins. Crosslinking studies in yeast. Methods Mol. Biol. 1999;119:469–479. - PubMed
Publication types
MeSH terms
Substances
LinkOut - more resources
Full Text Sources
Other Literature Sources
Molecular Biology Databases

