. 2010 May;12(5):457-67.
doi: 10.1038/ncb2047. Epub 2010 Apr 11.

Deciphering the transcriptional complex critical for RhoA gene expression and cancer metastasis

Affiliations

Deciphering the transcriptional complex critical for RhoA gene expression and cancer metastasis

Chia-Hsin Chan et al. Nat Cell Biol. 2010 May.

Abstract

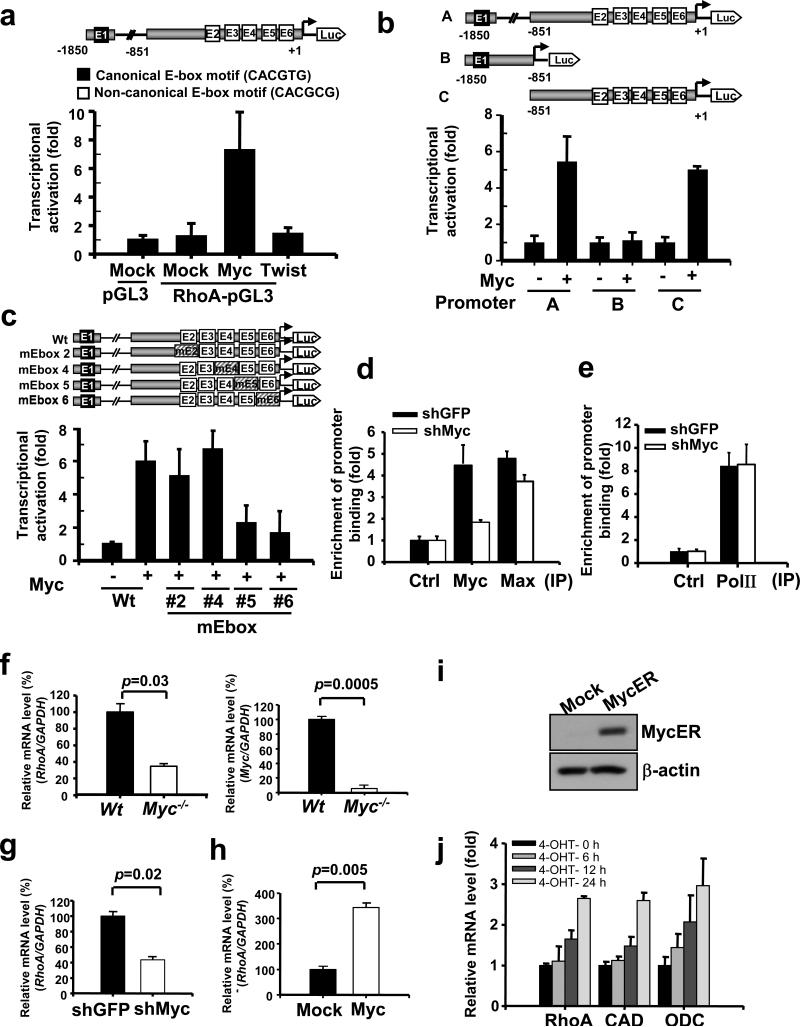
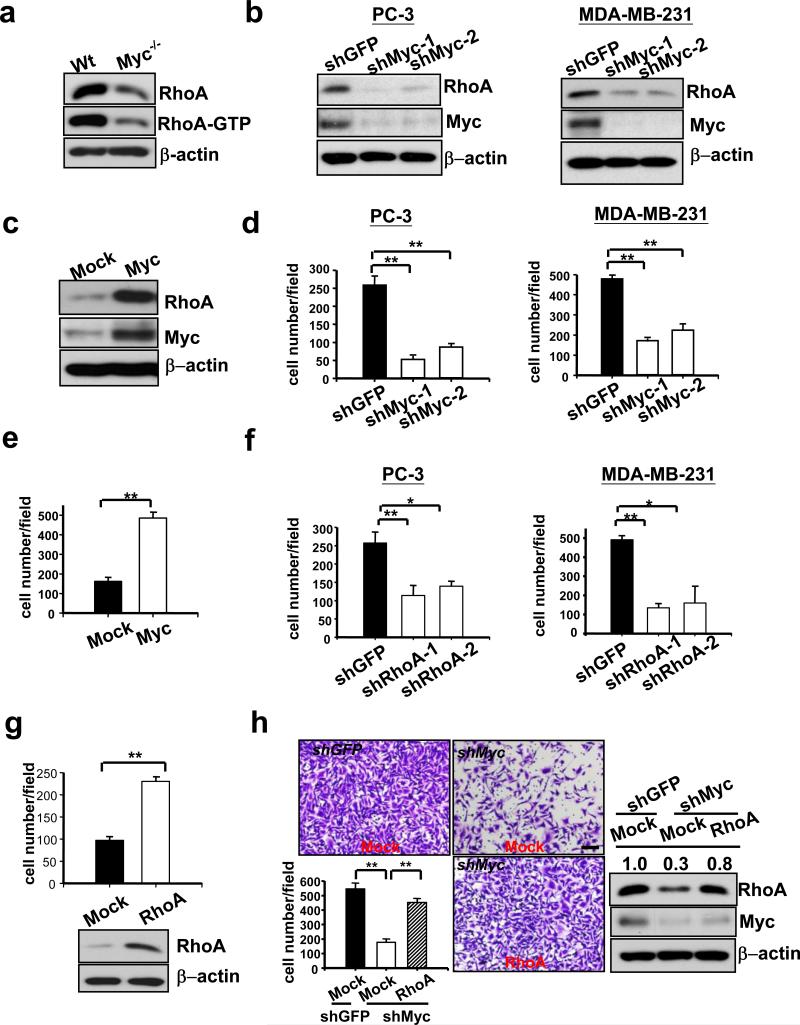
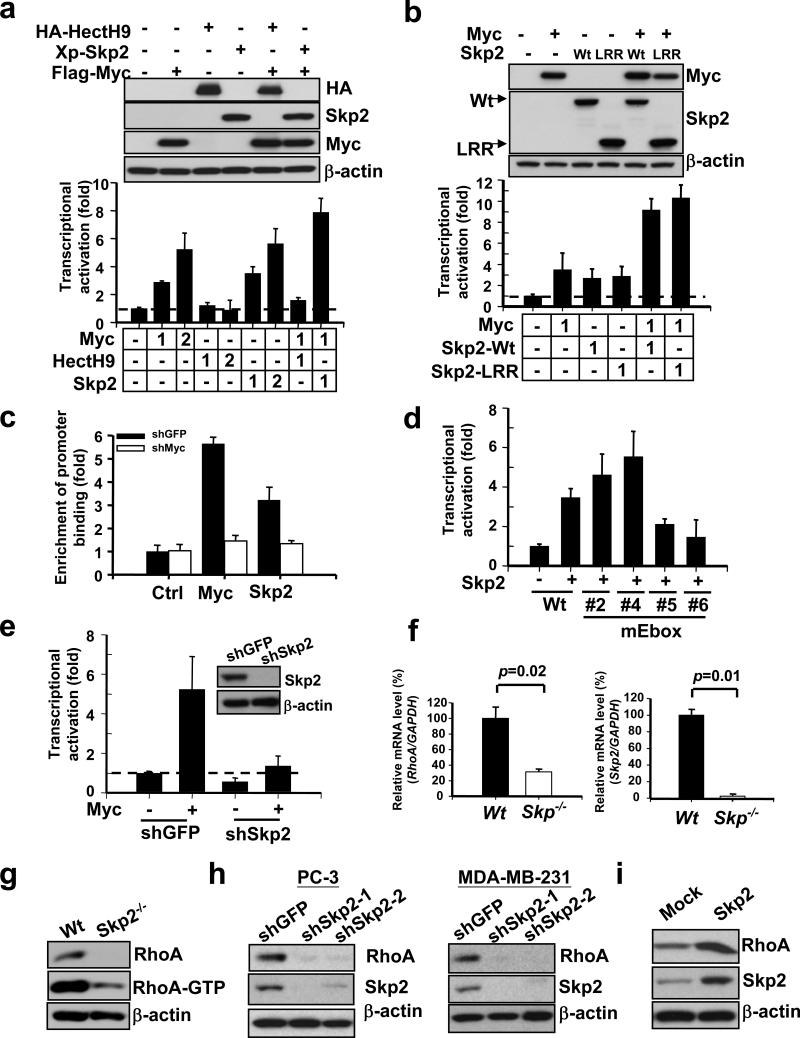
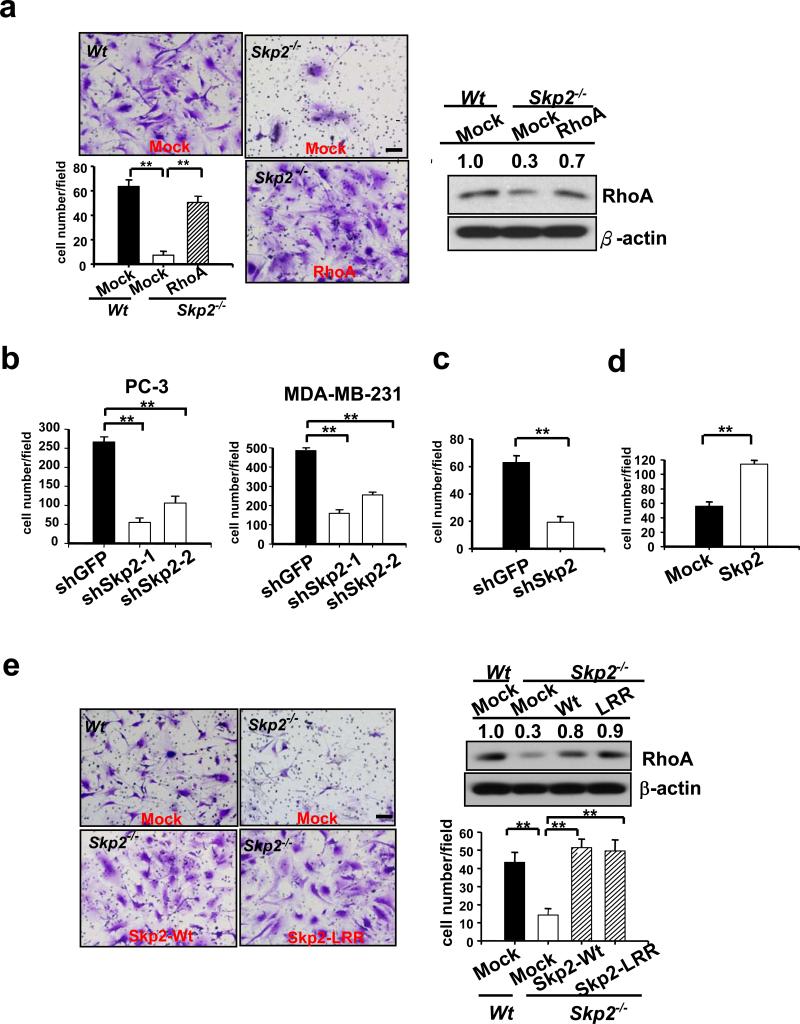
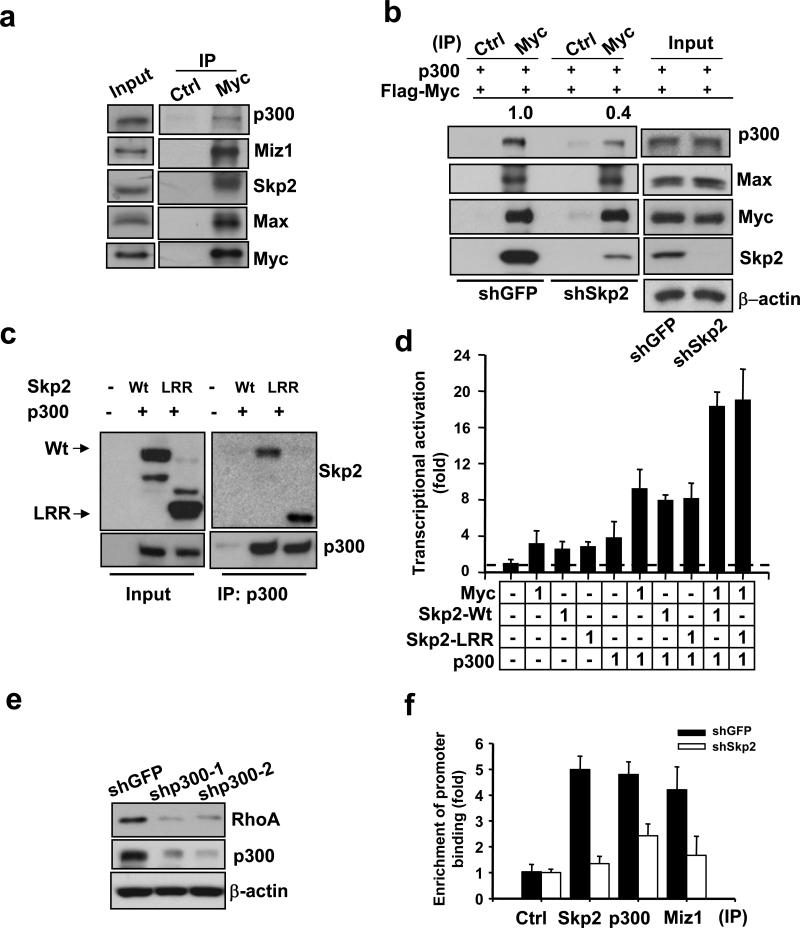
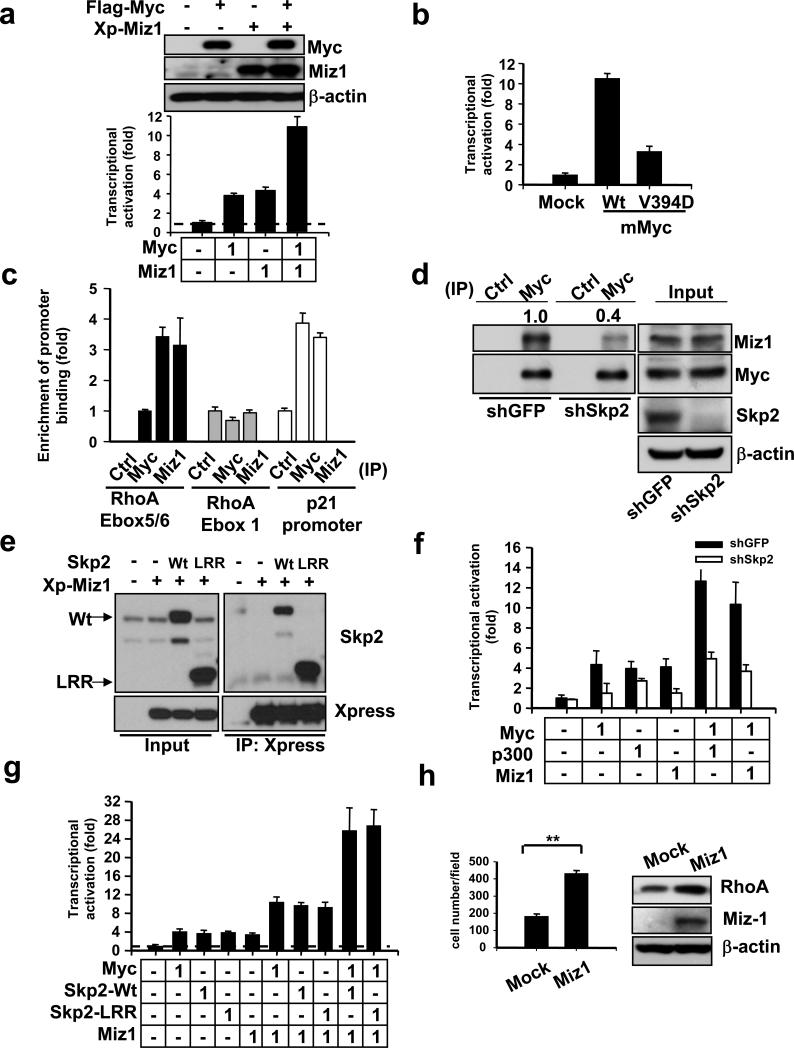
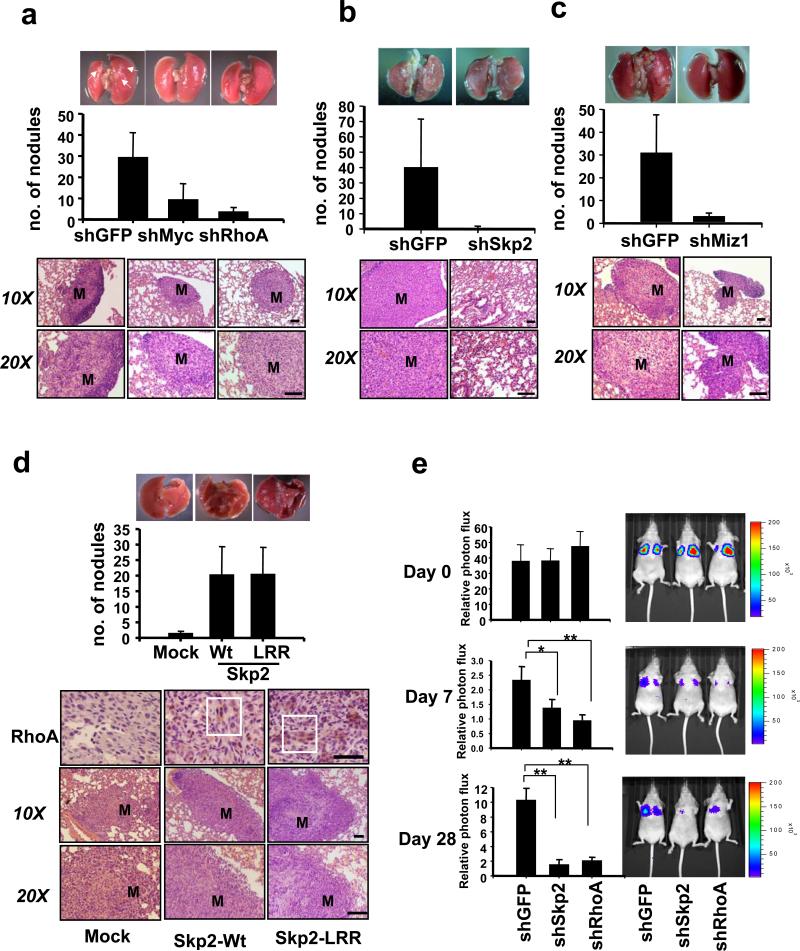
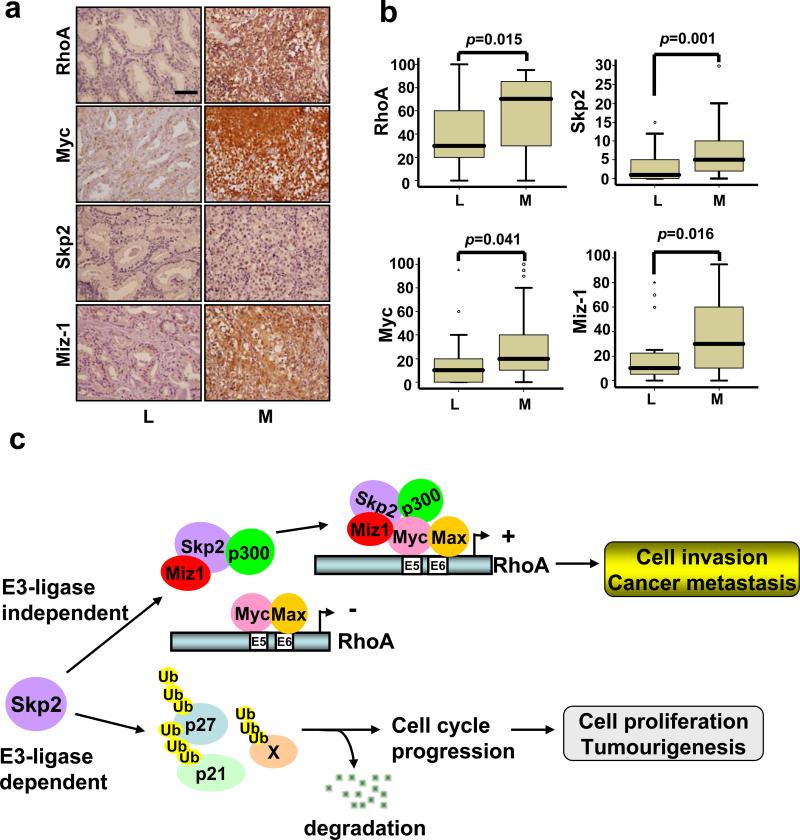
The RhoA GTPase is crucial in numerous biological functions and is linked to cancer metastasis. However, the understanding of the molecular mechanism responsible for RhoA transcription is still very limited. Here we show that RhoA transcription is orchestrated by the Myc-Skp2-Miz1-p300 transcriptional complex. Skp2 cooperates with Myc to induce RhoA transcription by recruiting Miz1 and p300 to the RhoA promoter independently of Skp1-Cullin-F-box protein containing complex (SCF)-Skp2 E3 ligase activity. Deficiency of this complex results in impairment in RhoA expression, cell migration, invasion, and breast cancer metastasis, recapitulating the phenotypes observed in RhoA knockdown, and RhoA restoration rescues the defect in cell invasion. Overexpression of the Myc-Skp2-Miz1 complex is found in metastatic human cancers and is correlated with RhoA expression. Our study provides insight into how oncogenic Skp2 and Myc coordinate to induce RhoA transcription and establishes a novel SCF-Skp2 E3-ligase-independent function for oncogenic Skp2 in transcription and cancer metastasis.


Figures

Figure 1
Figure 1. Myc is a transcription factor for RhoA
(a) 293T cells were transfected with the indicated plasmids and harvested for a RhoA reporter assay. (b) Various RhoA promoter fragment constructs used for the reporter assay. (c) Reporter assay in 293T cells transfected with various RhoA promoter constructs with mutations in different E-box regions. (d, e) ChIP assay in PC-3 cells with GFP- or Myc-knockdown. Myc knockdown efficiency was shown in the left panel of Fig. 2b. (f) Analysis of RhoA and Myc mRNA levels in Wt and Myc-null Rat1 cells by real-time PCR. The quantified results were presented as mean ± s.d. (n=3) (g) Analysis of RhoA mRNA levels in MDA-MB-231 cell lines infected with GFP or Myc knockdown. (h) Analysis of RhoA mRNA levels in MDA-MB-231 cell lines infected with MSCV or MSCV-Myc. (i) Western blot analysis of Myc protein expression in MDA-MB-231 cells infected with pBabe or pBabe-MycER. (j) Analysis of RhoA , CAD, and ODC mRNA levels in MDA-MB-231 cell lines following the time course of MycER activation induced by 4-OHT (4-hydoxytamoxifen). Results in panel a-c were shown as mean ± s.d. of one representative experiment (a, c from 4 independent experiments; b from 3 independent experiments) performed in triplicate. Results in panel d-h, j were presented as mean ± s.d. (n=3).
Figure 2
Figure 2. Myc regulates cell invasion through RhoA
(a) Western blot analysis of active RhoA (RhoA-GTP) and total RhoA expression in Wt Myc and Myc-null Rat1 cells. (b) Western blot analysis of RhoA expression in two cancer lines with GFP or Myc knockdown. Two Myc lentiviral shRNAs were used in this assay. (c) Western blot analysis of RhoA expression in MDA-MB-231 cells infected with MSCV or MSCV-Myc. (d) Matrigel cell invasion assay in two cancer cell lines with GFP or Myc knockdown. (e) Matrigel cell invasion assay in MDA-MB-231 cells infected with MSCV or MSCV-Myc. (f) Matrigel cell invasion assay in two cancer cell lines with GFP or RhoA knockdown. Two RhoA lentiviral shRNAs were used in this assay. (g) Matrigel cell invasion assay and Western blot analysis in MDA-MB-231 cells infected with MSCV or MSCV-RhoA. (h) Matrigel cell invasion assay and Western blot analysis in MDA-MB-231 cells with GFP, Myc knockdown, or Myc knockdown plus RhoA overexpression. The relative intensity of RhoA was quantified using ImageQuant software and normalized with β-actin. The quantified results were presented as mean ± s.d. (n=4). * indicates p<0.05; ** indicates p<0.01. Scale bar = 100 μm.
Figure 3
Figure 3. Skp2 cooperates with Myc to regulate RhoA transcription independent of Myc ubiquitination and SCF-Skp2 E3 ligase activity
(a, b) RhoA reporter assay in 293T cells transfected with the indicated plasmids. The number indicates the amount (μg) of the plasmids used in this assay (lower panel). Western blot analysis showing the expression of constructs as indicated (upper panel). (c) ChIP assay in PC-3 cells with GFP or Myc knockdown. The quantified results were presented as mean ± s.d. (n=3) (d) RhoA reporter assay in 293T cells transfected with various RhoA promoter constructs with mutations in different E-box regions. (e) RhoA reporter assay in 293T cells with GFP or Skp2 knockdown (left panel). Western blot analysis of Skp2 expression in 293T cells with GFP or Skp2 knockdown (right panel). (f) Analysis of RhoA and Skp2 mRNA levels in Wt and Skp2−/− primary MEFs by real-time PCR. The quantified results were presented as mean ± s.d. (n=3). (g) Western blot analysis of active RhoA (RhoA-GTP) and total RhoA expression in Wt and Skp2−/− primary MEFs. (h) Western blot analysis of RhoA expression in various cancer cell lines infected with GFP shRNA, Skp2 shRNA. Two Skp2 lentiviral shRNAs were used in this assay. (i) Western blot analysis in PC-3 cells infected with pBabe or pBabe-Skp2. Results in panel a, b, d, e were shown as mean ± s.d. of one representative experiment (from 3 independent experiments) performed in triplicate.
Figure 4
Figure 4. Skp2 regulates cell invasion independent of SCF-Skp2 E3 ligase activity
(a) Matrigel cell invasion assay and Western blot analysis of RhoA expression in Wt and Skp2−/− primary MEFs infected with MSCV or MSCV-RhoA. (b) Matrigel cell invasion assay in two cancer cell lines infected with GFP or Skp2 knockdown. (c) Transwell cell migration assay in PC-3 cells infected with GFP or Skp2 knockdown. (d) Transwell cell migration assay in PC-3 cells infected with pBabe or pBabe-Skp2. (e) Matrigel cell invasion assay and Western blot analysis of RhoA expression in Wt and Skp2−/− primary MEFs infected with pBabe, pBabe-Skp2, or pBabe-Skp2-LRR as indicated. The relative intensity of RhoA was quantified using ImageQuant software and normalized with β-actin. Results in panel b-d were shown as mean ± s.d. (n=4). * indicates p<0.05; ** indicates p<0.01. Scale bar = 100 μm
Figure 5
Figure 5. Skp2 cooperates with Myc to regulate RhoA transcription by recruiting p300
(a) Endogenous Myc interacts with endogenous p300, Miz1, Skp2, and Max in vivo. 293T total cell lysates were immunoprecipitated with Myc antibody, followed by Western blot analysis. (b) Co-immunoprecipitation assay in 293T cells with GFP or Skp2 knockdown. The relative intensity of p300 was quantified using ImageQuant software and normalized with the levels of immunoprecipitated Myc in GFP or Skp2-silenced cells. (c) Co-immunoprecipitation assay in 293T cells transfected with the indicated plasmids. (d) RhoA reporter assay in 293T cells transfected with the indicated plasmids. The number indicates the amount (μg) of the plasmids used in this assay. The results were shown as mean ± s.d. of one representative experiment (from 3 independent experiments) performed in triplicate. (e) Western blot analysis of p300 and RhoA expression in MDAMB-231 cells with GFP or p300 knockdown. Two p300 lentiviral shRNAs were used in this assay. (f) ChIP assay in PC-3 cells with GFP or Skp2 knockdown followed by real-time PCR analysis using various antibodies for immunoprecipitation as indicated. The quantified results were presented as mean ± s.d. (n=3).
Figure 6
Figure 6. Skp2 cooperates with Myc to regulate RhoA transcription by recruiting Miz1
(a) RhoA reporter assay and Western blot analysis in 293T cells transfected with the indicated plasmids. The number indicates the amount (μg) of the plasmids used in this assay (lower panel). Western blot analysis showing the expression of constructs as indicated (upper panel). (b) The effect of MycV394D mutant on RhoA transcription. RhoA reporter assay in 293T cells transfected with the mouse Wt Myc and MycV394D mutant. (c) ChIP assay in PC-3 cells followed by real-time PCR analysis using various antibodies for immunoprecipitation as indicated. The quantified results were presented as mean ± s.d. (n=3). (d) Endogenous immunoprecipitation assay in 293T cells with GFP or Skp2 knockdown. The relative intensity of Miz1 was quantified using ImageQuant software and normalized with the levels of immunoprecipitated Myc in GFP or Skp2-silenced cells. (e) Co-immunoprecipitation assay in 293T cells transfected with the indicated plasmids. (f) RhoA reporter assay in 293T cells with GFP or Skp2 knockdown transfected with plasmids as indicated. (g) RhoA reporter assay in 293T cells transfected with the indicated plasmids. (h) Matrigel cell invasion assay and Western blot analysis in MDA-MB-231 cells infected with MSCV or MSCV-Miz1. The quantified results were presented as the mean ± s.d. (n=4). Results in panel a, b, f, g were shown as mean ± s.d. of one representative experiment (from 3 independent experiments) performed in triplicate.
Figure 7
Figure 7. The Myc/Skp2/Miz1 complex regulates cancer metastasis in mouse model
(a-c) Lung metastasis assay and histological analysis from nude mice injected with MnDA-MB-231 cells with GFP, Myc, RhoA, Skp2 or Miz1 knockdown. (n = 6 for each group) (d) Lung metastasis assay and histological analysis from nude mice injected with MDA-MB-231 cells infected with pBabe, pBabe-Skp2-Wt or pBabe-Skp2-LRR. IHC of RhoA protein expression in metastatic breast tumour in the lung obtained from nude mice injected with MDA-MB-231 cells with pBabe, pBabe-Skp2-Wt or pBabe-Skp2-LRR. (n = 5 for each group) “M” represents the metastatic nodule. The white box indicates that RhoA protein expression was enhanced. (e) MDA-MB-231-Luc cells with GFP, Skp2, or RhoA knockdown were injected to the nude mice, and the kinetics of breast cancer metastasis to the lung were measured by bioluminescence and quantified. Representative bioluminescent images were shown in day 0, 7, and 28. The results are presented as mean values ± s.d. (n = 7 for each group).* indicates p<0.05; ** indicates p<0.01. Scale bar = 100 μm.
Figure 8
Figure 8. The Myc/Skp2/Miz1 complex is overexpressed and correlated with RhoA expression in metastatic prostate cancer samples
(a) The expression of RhoA, Myc, Skp2, and Miz1 in representative cases of primary prostate adenocarcinomas that remained localized (L) or developed metastasis (M). The labeling indices of RhoA, Myc, Skp2, and Miz1 were appeared lower in the localized tumour but indicated significant overexpression in the case with metastasis. Original magnification, × 400; Scale bar = 100 μm. (b) The expression of RhoA, Myc, Skp2, and Miz1 in primary prostate cancer versus metastatic prostate cancer. (c) The working model for SCF-Skp2 E3 ligase-dependent and -independent functions.

Similar articles

Cited by

References

    1. Chiang AC, Massague J. Molecular basis of metastasis. N Engl J Med. 2008;359:2814–2823. - PMC - PubMed
    1. Yang J, Weinberg RA. Epithelial-mesenchymal transition: at the crossroads of development and tumor metastasis. Dev Cell. 2008;14:818–829. - PubMed
    1. Jaffe AB, Hall A. Rho GTPases: biochemistry and biology. Annu Rev Cell Dev Biol. 2005;21:247–269. - PubMed
    1. Lahoz A, Hall A. DLC1: a significant GAP in the cancer genome. Genes Dev. 2008;22:1724–1730. - PMC - PubMed
    1. Moscow JA, et al. Examination of human tumors for rhoA mutations. Oncogene. 1994;9:189–194. - PubMed

Publication types

Substances