mRNA deep sequencing reveals 75 new genes and a complex transcriptional landscape in Mimivirus
- PMID: 20360389
- PMCID: PMC2860168
- DOI: 10.1101/gr.102582.109
mRNA deep sequencing reveals 75 new genes and a complex transcriptional landscape in Mimivirus
Abstract
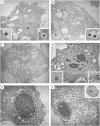
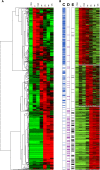
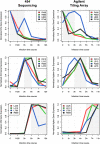
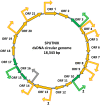
Mimivirus, a virus infecting Acanthamoeba, is the prototype of the Mimiviridae, the latest addition to the nucleocytoplasmic large DNA viruses. The Mimivirus genome encodes close to 1000 proteins, many of them never before encountered in a virus, such as four amino-acyl tRNA synthetases. To explore the physiology of this exceptional virus and identify the genes involved in the building of its characteristic intracytoplasmic "virion factory," we coupled electron microscopy observations with the massively parallel pyrosequencing of the polyadenylated RNA fractions of Acanthamoeba castellanii cells at various time post-infection. We generated 633,346 reads, of which 322,904 correspond to Mimivirus transcripts. This first application of deep mRNA sequencing (454 Life Sciences [Roche] FLX) to a large DNA virus allowed the precise delineation of the 5' and 3' extremities of Mimivirus mRNAs and revealed 75 new transcripts including several noncoding RNAs. Mimivirus genes are expressed across a wide dynamic range, in a finely regulated manner broadly described by three main temporal classes: early, intermediate, and late. This RNA-seq study confirmed the AAAATTGA sequence as an early promoter element, as well as the presence of palindromes at most of the polyadenylation sites. It also revealed a new promoter element correlating with late gene expression, which is also prominent in Sputnik, the recently described Mimivirus "virophage." These results-validated genome-wide by the hybridization of total RNA extracted from infected Acanthamoeba cells on a tiling array (Agilent)--will constitute the foundation on which to build subsequent functional studies of the Mimivirus/Acanthamoeba system.
Figures


Similar articles
-
Mimivirus and its virophage.Annu Rev Genet. 2009;43:49-66. doi: 10.1146/annurev-genet-102108-134255. Annu Rev Genet. 2009. PMID: 19653859 Review.
-
Distant Mimivirus relative with a larger genome highlights the fundamental features of Megaviridae.Proc Natl Acad Sci U S A. 2011 Oct 18;108(42):17486-91. doi: 10.1073/pnas.1110889108. Epub 2011 Oct 10. Proc Natl Acad Sci U S A. 2011. PMID: 21987820 Free PMC article.
-
Sputnik, a virophage infecting the viral domain of life.Adv Virus Res. 2012;82:63-89. doi: 10.1016/B978-0-12-394621-8.00013-3. Adv Virus Res. 2012. PMID: 22420851 Review.
-
Experimental Analysis of Mimivirus Translation Initiation Factor 4a Reveals Its Importance in Viral Protein Translation during Infection of Acanthamoeba polyphaga.J Virol. 2018 Apr 27;92(10):e00337-18. doi: 10.1128/JVI.00337-18. Print 2018 May 15. J Virol. 2018. PMID: 29514904 Free PMC article.
-
The polyadenylation site of Mimivirus transcripts obeys a stringent 'hairpin rule'.Genome Res. 2009 Jul;19(7):1233-42. doi: 10.1101/gr.091561.109. Epub 2009 Apr 29. Genome Res. 2009. PMID: 19403753 Free PMC article.
Cited by
-
Deep RNA sequencing reveals complex transcriptional landscape of a bat adenovirus.J Virol. 2013 Jan;87(1):503-11. doi: 10.1128/JVI.02332-12. Epub 2012 Oct 24. J Virol. 2013. PMID: 23097437 Free PMC article.
-
Modulation of the expression of mimivirus-encoded translation-related genes in response to nutrient availability during Acanthamoeba castellanii infection.Front Microbiol. 2015 Jun 1;6:539. doi: 10.3389/fmicb.2015.00539. eCollection 2015. Front Microbiol. 2015. PMID: 26082761 Free PMC article.
-
Exploration of the propagation of transpovirons within Mimiviridae reveals a unique example of commensalism in the viral world.ISME J. 2020 Mar;14(3):727-739. doi: 10.1038/s41396-019-0565-y. Epub 2019 Dec 10. ISME J. 2020. PMID: 31822788 Free PMC article.
-
Virophages and retrotransposons colonize the genomes of a heterotrophic flagellate.Elife. 2021 Oct 26;10:e72674. doi: 10.7554/eLife.72674. Elife. 2021. PMID: 34698016 Free PMC article.
-
Viva lavidaviruses! Five features of virophages that parasitize giant DNA viruses.PLoS Pathog. 2019 Mar 21;15(3):e1007592. doi: 10.1371/journal.ppat.1007592. eCollection 2019 Mar. PLoS Pathog. 2019. PMID: 30897185 Free PMC article. No abstract available.
References
Publication types
MeSH terms
Substances
LinkOut - more resources
Full Text Sources
