. 2010 Apr 20;107(16):7461-6.
doi: 10.1073/pnas.1002459107. Epub 2010 Mar 29.

Phosphate-activated glutaminase (GLS2), a p53-inducible regulator of glutamine metabolism and reactive oxygen species

Affiliations

Phosphate-activated glutaminase (GLS2), a p53-inducible regulator of glutamine metabolism and reactive oxygen species

Sawako Suzuki et al. Proc Natl Acad Sci U S A. .

Abstract

We identified a p53 target gene, phosphate-activated mitochondrial glutaminase (GLS2), a key enzyme in conversion of glutamine to glutamate, and thereby a regulator of glutathione (GSH) synthesis and energy production. GLS2 expression is induced in response to DNA damage or oxidative stress in a p53-dependent manner, and p53 associates with the GLS2 promoter. Elevated GLS2 facilitates glutamine metabolism and lowers intracellular reactive oxygen species (ROS) levels, resulting in an overall decrease in DNA oxidation as determined by measurement of 8-OH-dG content in both normal and stressed cells. Further, siRNA down-regulation of either GLS2 or p53 compromises the GSH-dependent antioxidant system and increases intracellular ROS levels. High ROS levels following GLS2 knockdown also coincide with stimulation of p53-induced cell death. We propose that GLS2 control of intracellular ROS levels and the apoptotic response facilitates the ability of p53 to protect cells from accumulation of genomic damage and allows cells to survive after mild and repairable genotoxic stress. Indeed, overexpression of GLS2 reduces the growth of tumor cells and colony formation. Further, compared with normal tissue, GLS2 expression is reduced in liver tumors. Thus, our results provide evidence for a unique metabolic role for p53, linking glutamine metabolism, energy, and ROS homeostasis, which may contribute to p53 tumor suppressor function.


Conflict of interest statement

The authors declare no conflict of interest.

Figures
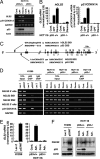
Fig. 1.
Fig. 1.
Identification of phosphate-activated GLS (GLS2) as a p53-inducible gene. (A) HCT116 (p53+/+) or (p53−/−) cells were treated with camptothecin (CPT; 300 nM) or daunorubicin (Dauno; 200 nM). RT-PCR analysis for GLS2, p21/CDKN1A, and GAPDH expression (top three panels) and immunoblotting to detect p53 (DO1) and actin (Sigma; bottom two panels) were performed. (B) HCT116 cells were treated with indicated agents as in A. Total RNA was subjected to real-time RT-PCR analysis. Expression levels of GLS2 (Left) and p21/CDKN1A (Right) RNAs were determined by the comparative threshold cycle method and then normalized by L32 expression. (C) Genomic structure of human GLS2 with its exon/intron organization and two potential p53 binding sites upstream of the first exon (GLS2 BS1 and GLS2 BS2) compared with the canonical p53 binding site. R, purine; Y, pyrimidine; W, adenine or thymine. (D) H1299 cells infected with adenoviruses expressing either LacZ or p53 (p53WT) for 24 h (Left) and HCT116 (p53+/+) or (p53−/−) cells either not treated (Control) or treated with daunorubicin (200 nM) or CPT (300 nM) for 24 h (Right) were processed for ChIP assays using anti-p53 (DO1/1801) or control IgG (Santa Cruz Biotechnology), followed by the amplification of p53 binding sites as indicated. (E) H1299 cells (Left) were infected with adenoviruses expressing either LacZ or p53 (p53WT) or HCT116 cells (p53+/+; Right) or (p53−/−) cells were treated with doxorubicin (Adr., 0.3 μM) for 24 h. Expression level of GLS2 mRNA was determined as in B. (F) Cells were treated as in E and subjected to mitochondrial fractionation. Immunoblotting was performed to detect GLS2 protein in the mitochondrial fraction and p53 and actin from whole extracts.
Fig. 2.
Fig. 2.
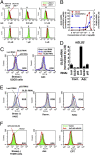
Modulation of GLS2 or p53 expression affects intracellular ROS levels. (A) HCT116 cells that either express p53 (p53+/+ in green) or lack p53 (p53−/− in red) were treated with the indicated doses of doxorubicin for 24 h and then subjected to DCF staining followed by FACS analysis. (B) HCT116 p53+/+ cells were treated with indicated dose of doxorubicin as in A. Expression levels of GLS2, p21/CDKN1A, and PUMA mRNAs were determined as in Fig. 1B. (C) U2OS cells were transfected with luciferase RNAi (Luci RNAi; gray), p53 RNAi (blue), or GLS2 RNAi (red) for 24 h and then cells were either not treated (stress −; Left) or treated with doxorubicin (100 nM; Right) for 24 h. DCF staining was followed by FACS analysis. (D) U2OS cells were transfected with indicated RNAi and then treated with doxorubicin as in C. Expression levels of GLS2 mRNA were determined as in Fig. 1B. (E) HAEC cells were transfected as in C and then either not treated (stress −) or treated with daunorubicin (100 nM) or H2O2 (0.1 mM) for 24 h. DCF staining was followed by FACS analysis. (F) Cells were transfected with indicated DNA for 48 h. After the selection in the presence of 600 μg/mL G418 for 5 d, cells were split, cultured for 24 h, and then not treated (stress −) or treated with doxorubicin or CPT for another 24 h. DCF staining was followed by FACS analysis.
Fig. 3.
Fig. 3.
GLS2 controls glutamine metabolism and GSH antioxidant capacity to decrease intracellular ROS levels. (A) Cells were transfected with indicated plasmids for 24 h and then switched to fresh medium. Glutamine consumption is represented as a ratio to initial concentration and graphs show the mean of six measurements from two independent experiments, with error bars representing SD. (B) Cells were transfected with luciferase RNAi (closed circles and squares) or GLS2 RNAi (closed triangles) for 12 h and then cells were infected with adenoviruses expressing either LacZ or WT p53 (p53WT) at a multiplicity of infection of 2 for another 24 h. Cultures were switched to fresh medium and glutamine consumption and glutamate production was calculated as in A. (C) Cells were transfected with indicated plasmids for 48 h. After the selection in the presence of 600 μg/mL G418 for 5 d, cells were split and cultured for 24 h, and then not treated (control) or treated with daunorubicin or CPT for another 24 h. Cells were collected and subjected to GSH and GSSG assay as described in Materials and Methods. Graphs show the mean of two independent experiments, with error bars representing SD. (D) Cells were transfected with indicated RNAi for 24 h and then either not treated (control; Left) or treated with doxorubicin (100 nM; Right) for another 24 h. Cells were collected and subjected to GSH and GSSG assay as in C. (E) HCT116 cells that either express p53 (p53+/+) or lack p53 (p53−/−) were cultured exponentially and then subjected to GSH and GSSG assay as in C. (F) HCT116 (p53+/+) cells were cultured exponentially and then switched to normal medium containing 100% (584 mg/L) L-glutamine (GLN), or glutamine depletion medium containing 1% (5.8 mg/L) GLN, and then cultured for 36 h. Assay of GSH and GSSG was performed as in C. (G) HCT116 cells that either express p53 (p53+/+) or lack p53 (p53−/−) were cultured exponentially (Left) or HCT116 p53+/+ cells were switched to normal medium (GLN; 100%) or glutamine depletion medium (GLN; 1%) for 36 h as in F. DCF staining was followed by FACS analysis.
Fig. 4.
Fig. 4.
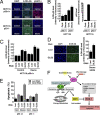
p53 and GLS2 regulate DNA oxidation and ROS-mediated apoptosis. (A) HCT116 cells were untreated (control) or treated with daunorubicin (Dauno.; 100 nM) for 24 h and then fixed and stained using anti–8-OH-dG antibody and anti-p53 polyclonal antibody (FL) and visualized using Alexa Fluor–488– and -594–conjugated secondary antibodies. Nuclei were counterstained with DAPI and images were taken using a Keyence microscope. (B) HCT116 cells were treated as in A. Intensity of 8-OH-dG (Left) and p53 (Right) staining was quantified using Keyence software. The average of six random visual fields from two independent experiments is shown, with error bars representing SD. (C) HCT116 cells expressing WT p53 (p53+/+) were transfected with indicated RNAi for 24 h and then cells were either not treated (untreated) or treated with daunorubicin (100 nM) for another 24 h. DNA oxidation was detected as in A and quantified as in B. (D) U2OS cells were transfected with luciferase RNAi or GLS2 RNAi and then treated with daunorubicin (100 nM) as in C. DNA oxidation was detected and quantified as in C. (E) HCT116 (p53+/+) or (p53−/−) cells were transfected with luciferase RNAi (Luci) or GLS2 RNAi for 24 h and then were either not treated (control) or treated with daunorubicin (300 nM) for another 36 h. The amount of sub–G0/G1 cells was calculated using the Cell Quest program for FACS. Average of three independent experiments is shown, with error bars indicating SD. (F) Model for regulation of intracellular ROS levels by GLS2. Upon oxidative stress or DNA damage, p53 is stabilized and activated to induce several targets including antioxidant and prooxidant genes. One such target, GLS2, catalyzes the hydrolysis of glutamine to produce glutamate and NH4+ and functions as an antioxidant protein. In response to severe cellular stress or irreparable damage p53 transactivates prooxidant genes (PUMA, PIG3, Proline Oxidase), resulting in the elevation of intracellular ROS, and apoptosis. The balance between anti- and prooxidant genes and the differential regulation of p53 targets can determine the choice of cellular outcomes.
Fig. 5.
Fig. 5.
GLS2 inhibits tumor cell growth and colony formation and GLS2 expression is decreased in liver tumors. (A) Cells were transfected as indicated for 48 h. Cells were then split and subjected to the cell growth analysis (Left) or colony formation assay visualized by crystal violet staining (Right). (B) Loss or reduction of GLS2 mRNA expression in human liver tumors. N, normal liver; L, tumor adjacent tissues with chronic hepatitis; HCC, hepatocellular carcinoma; MC, liver-metastatic tumor of colorectal carcinomas. The expression of GLS2 mRNA were determined by real-time PCR and normalized by actin expression.

Comment in

Similar articles

Cited by

References

    1. Deberardinis RJ, Sayed N, Ditsworth D, Thompson CB. Brick by brick: metabolism and tumor cell growth. Curr Opin Genet Dev. 2008;18:54–61. - PMC - PubMed
    1. Kroemer G, Pouyssegur J. Tumor cell metabolism: cancer's Achilles’ heel. Cancer Cell. 2008;13:472–482. - PubMed
    1. Vousden KH, Ryan KM. p53 and metabolism. Nat Rev Cancer. 2009;9:691–700. - PubMed
    1. Warburg O. On the origin of cancer cells. Science. 1956;123:309–314. - PubMed
    1. Vander Heiden MG, Cantley LC, Thompson CB. Understanding the Warburg effect: the metabolic requirements of cell proliferation. Science. 2009;324:1029–1033. - PMC - PubMed

Publication types