. 2010 Jun;84(11):5615-26.
doi: 10.1128/JVI.02094-09. Epub 2010 Mar 24.

Bocavirus infection induces mitochondrion-mediated apoptosis and cell cycle arrest at G2/M phase

Affiliations

Bocavirus infection induces mitochondrion-mediated apoptosis and cell cycle arrest at G2/M phase

Aaron Yun Chen et al. J Virol. 2010 Jun.

Abstract

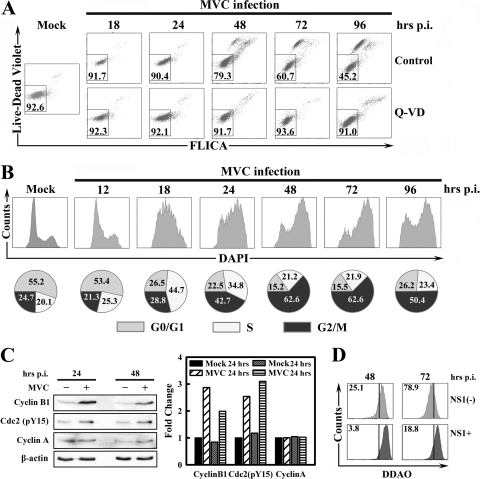
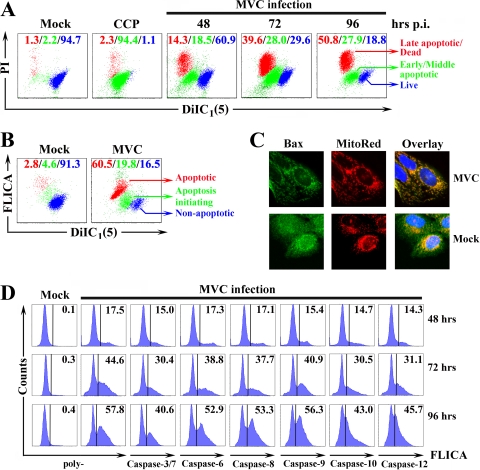
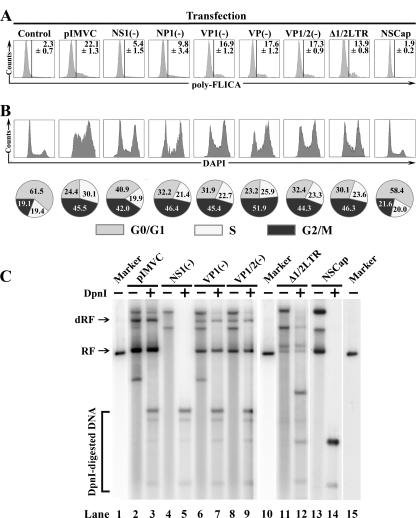
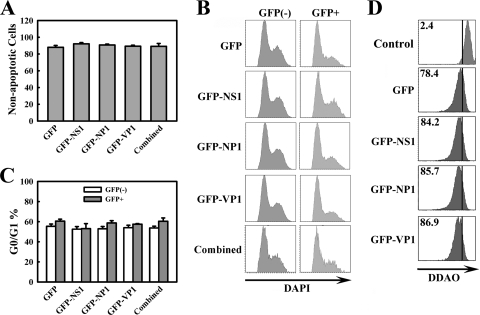
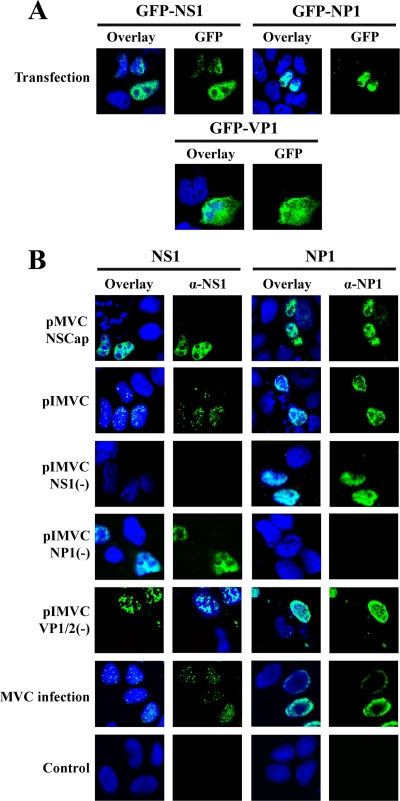
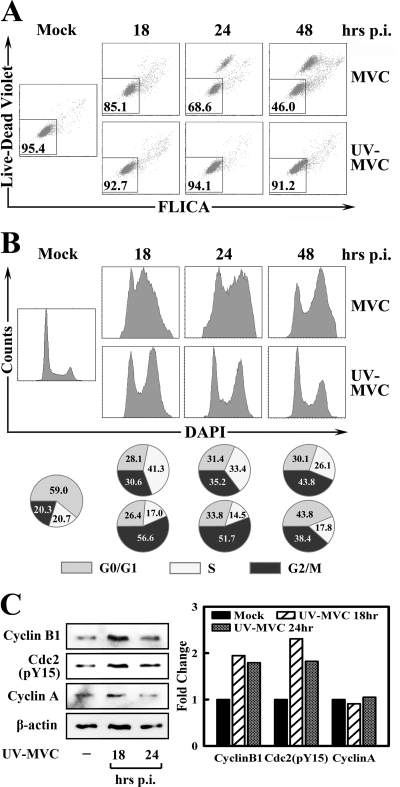
Bocavirus is a newly classified genus of the family Parvovirinae. Infection with Bocavirus minute virus of canines (MVC) produces a strong cytopathic effect in permissive Walter Reed/3873D (WRD) canine cells. We have systematically characterized the MVC infection-produced cytopathic effect in WRD cells, namely, the cell death and cell cycle arrest, and carefully examined how MVC infection induces the cytopathic effect. We found that MVC infection induces an apoptotic cell death characterized by Bax translocalization to the mitochondrial outer membrane, disruption of the mitochondrial outer membrane potential, and caspase activation. Moreover, we observed that the activation of caspases occurred only when the MVC genome was replicating, suggesting that replication of the MVC genome induces apoptosis. MVC infection also induced a gradual cell cycle arrest from the S phase in early infection to the G(2)/M phase at a later stage, which was confirmed by the upregulation of cyclin B1 and phosphorylation of cdc2. Cell cycle arrest at the G(2)/M phase was reproduced by transfection of a nonreplicative NS1 knockout mutant of the MVC infectious clone, as well as by inoculation of UV-irradiated MVC. In contrast with other parvoviruses, only expression of the MVC proteins by transfection did not induce apoptosis or cell cycle arrest. Taken together, our results demonstrate that MVC infection induces a mitochondrion-mediated apoptosis that is dependent on the replication of the viral genome, and the MVC genome per se is able to arrest the cell cycle at the G(2)/M phase. Our results may shed light on the molecular pathogenesis of Bocavirus infection in general.


Figures

FIG. 1.
FIG. 1.
MVC infection induces apoptosis and cell cycle arrest. WRD cells were infected with MVC at an MOI of 3. (A) Cells were cultured in media supplemented with DMSO as a control or a pan-caspase inhibitor Q-VD (R&D Systems) at 40 μM immediately after infection. At indicated times p.i., infected cells were triple stained by anti-NS1, Live/Dead Violet, and poly-FLICA. Anti-NS1-stained cells were selected and plotted as Live/Dead Violet versus poly-FLICA fluorescence. The percentage of live cells (double negative) is shown in the square gate. (B) At the indicated times p.i., cells were double stained by anti-NS1 and DAPI. The anti-NS1-stained cells were selected and plotted as cell counts versus DAPI staining. Percentages of cells in the G0/G1, S, and G2/M phases are shown in circle graphs at the bottom of the panel. (C) Mock- and MVC-infected WRD cells were harvested at 24 h and 48 h p.i., respectively. Cell lysates were subjected to Western blotting using anti-cyclin B1, anti-cdc2 (pY15), anti-cyclin A, and anti-β-actin, respectively. The levels of signals on blots, which are normalized to the level of β-actin, are shown in the bar chart to the right. The normalized value of the mock cells at 24 h is arbitrarily set to 1. (D) At 24 h and 48 h p.i., MVC-infected WRD cells were stained with DDAO and anti-NS1. Both anti-NS1-positive (NS1+) and anti-NS1-negative [NS1(−)] populations were gated and plotted as histograms of cell counts versus DDAO signal. Numbers as shown are percentages of proliferated cells. The line as shown is arbitrarily set based on the nonproliferated control cells, which were fixed immediately after infection. A representative of two independent experiments is shown in panels A to D.
FIG. 2.
FIG. 2.
MVC infection-induced apoptosis is mitochondrion mediated. WRD cells were infected with MVC at an MOI of 3. (A) MVC-infected cells were harvested at indicated times p.i. and double stained with PI and DilC1(5). A mock infection control and an MOMP-positive control (CCCP-treated cells) were included. Stained cells were thereafter analyzed by flow cytometry and plotted as PI staining versus DilC1(5) staining. The DilC1(5)high/PI (blue) population represents live cells; DilC1(5)low/PI (green) cells are in the early and middle stages of apoptosis; DilC1(5)low/PI+ (red) cells are late apoptotic or dead cells. The percentage of each cell population is shown in color. A representative of two independent experiments is shown. (B) MVC-infected WRD cells, at 96 h p.i., were double stained with poly-FLICA and DilC1(5). A representative dot plot is shown. The DilC1(5)high/FLICA (blue) population represents live cells; the DilC1(5)low/FLICA (green) population are cells in the initial stage of apoptosis; the DilC1(5)low/FLICA+ (red) population are both apoptotic and dead cells. The percentage of each cell population is shown in color. (C) At 48 h p.i., mock- or MVC-infected WRD cells were stained with MitoTracker Red (red) and anti-Bax (green). Representative confocal images were taken. Nuclei were stained with DAPI. (D) At the indicated times p.i., MVC-infected WRD cells were stained with anti-NS1 and various FLICA peptides as shown. Anti-NS1-stained cells were selectively gated and plotted in histogram form to show the FLICA signals of NS1-expressing cells. Mock cells were all plotted as poly-FLICA staining. The percentage of FLICA positive cells is shown. A representative of two independent experiments is shown.
FIG. 3.
FIG. 3.
Replication of the MVC genome activates caspases, and the MVC genome per se arrests cell cycle at the G2/M phase. WRD cells were transfected with plasmids as shown. (A) At 48 h posttransfection, transfected cells were costained with anti-NS1, except for pIMVCNS1(−)-transfected cells, which were costained with anti-NP1 and poly-FLICA peptide. The anti-NS1-positive or anti-NP1-positive population was selectively gated and plotted as cell counts and FLICA signal. The percentage of FLICA-positive cells is shown as an average with a standard deviation generated from three independent experiments. (B) At 48 h posttransfection, transfected cells were costained with anti-NS1, except for pIMVCNS1(−)-transfected cells, which were costained with anti-NP1 and DAPI. Anti-NS1- or anti-NP1-stained cells were selectively gated and plotted as cell counts and DAPI signal. The percentage of each cell cycle phase was quantified and is shown as a pie graph at the bottom of the panel. A representative of two independent experiments is shown. (C) Southern blotting analysis of transfected WRD cells. At 48 h posttransfection, transfected cells were harvested and Hirt DNA was prepared. Hirt DNA was then digested with DpnI. The blot was probed with the NSCap probe as previously described (60). Detected bands are indicated with their respective designations to the left. Lanes 1, 10, and 15 are size markers of 5.15 kb. RF, replicative form; dRF, double replicative form.
FIG. 4.
FIG. 4.
Expression of individual MVC proteins or in combination by transfection does not induce cell death or cell cycle arrest. WRD cells were transfected with various constructs, as shown, that express GFP-fused MVC proteins. (A) Transfected cells were costained with annexin V-PI at 48 h posttransfection. The GFP-positive population was selectively gated. The percentage of nonapoptotic cells (annexin V/PI population) in the GFP-positive population in each transfection was then plotted. All the values were generated from three independent experiments and are shown as an average with a standard deviation. (B) Representative results of cell cycle analysis. Transfected cells were stained with DAPI at 48 h posttransfection. The GFP-positive population was selectively gated. The cell cycle analysis results are shown as GFP-negative population versus GFP-positive population. (C)The percentage of cells at the G0/G1 phase is shown as an average with a standard deviation obtained from three independent experiments. (D) Transfected cells were stained with DDAO at 48 h posttransfection. The GFP-positive population was selectively gated and plotted. Numbers as shown are percentages of proliferated cells. The line as shown is arbitrarily set in the control cells, which were fixed immediately after transfection.
FIG. 5.
FIG. 5.
Cellular localization of MVC proteins during infection and in transfection. (A) WRD cells were transfected with constructs expressing GFP-fused MVC proteins as shown. Cells were treated at 48 h posttransfection. (B) WRD cells were infected with MVC at an MOI of 3 or transfected with the MVC constructs as indicated. At 48 h p.i. or posttransfection, cells were stained with anti-NS1 (α-NS1) and anti-NP1 (α-NP1), respectively. Confocal images were taken at ×60 magnification. Nuclei were stained with DAPI.
FIG. 6.
FIG. 6.
UV-MVC inoculation induces cell cycle arrest at G2/M but not cell death. WRD cells were infected by MVC or inoculated with UV-MVC at an MOI of 9. (A) Infected or inoculated cells were costained with Live/Dead Violet and poly-FLICA peptide at indicated times p.i. Stained cells were plotted in histograms as Live/Dead Violet and FLICA signals. The numbers in the square show percentages of live cells (double negative). (B) At 48 h p.i., mock- or UV-MVC-infected cells were stained with DAPI and plotted as cell counts and DAPI signal. The percentage of each cell cycle phase was quantified and is shown as a pie graph at the bottom of the panel. (C) UV-MVC-infected cells were harvested at indicated times p.i. Cell lysates were subjected to Western blotting analysis using anti-cyclin B1, anti-cdc2 (pY15), anti-cyclin A, and anti-β-actin, respectively. The level of signals on blots is normalized to the level of β-actin and is shown in the bar chart. The normalized value of the mock cells is arbitrarily set to 1. A representative of two independent experiments is shown in panels A and B.

Similar articles

Cited by

References

    1. Abdel-Latif, L., B. K. Murray, R. L. Renberg, K. L. O'Neill, H. Porter, J. B. Jensen, and F. B. Johnson. 2006. Cell death in bovine parvovirus-infected embryonic bovine tracheal cells is mediated by necrosis rather than apoptosis. J. Gen. Virol. 87:2539-2548. - PubMed
    1. Allander, T. 2008. Human bocavirus. J. Clin. Virol. 41:29-33. - PubMed
    1. Allander, T., T. Jartti, S. Gupta, H. G. Niesters, P. Lehtinen, R. Osterback, T. Vuorinen, M. Waris, A. Bjerkner, A. Tiveljung-Lindell, B. G. van den Hoogen, T. Hyypia, and O. Ruuskanen. 2007. Human bocavirus and acute wheezing in children. Clin. Infect. Dis. 44:904-910. - PMC - PubMed
    1. Allander, T., M. T. Tammi, M. Eriksson, A. Bjerkner, A. Tiveljung-Lindell, and B. Andersson. 2005. Cloning of a human parvovirus by molecular screening of respiratory tract samples. Proc. Natl. Acad. Sci. U. S. A. 102:12891-12896. - PMC - PubMed
    1. Andersen, J. L., E. S. Zimmerman, J. L. DeHart, S. Murala, O. Ardon, J. Blackett, J. Chen, and V. Planelles. 2005. ATR and GADD45alpha mediate HIV-1 Vpr-induced apoptosis. Cell Death Differ. 12:326-334. - PubMed

Publication types