. 2010 Mar 12;6(3):e1000805.
doi: 10.1371/journal.ppat.1000805.

Dynamic imaging of experimental Leishmania donovani-induced hepatic granulomas detects Kupffer cell-restricted antigen presentation to antigen-specific CD8 T cells

Affiliations

Dynamic imaging of experimental Leishmania donovani-induced hepatic granulomas detects Kupffer cell-restricted antigen presentation to antigen-specific CD8 T cells

Lynette Beattie et al. PLoS Pathog. .

Abstract

Kupffer cells (KCs) represent the major phagocytic population within the liver and provide an intracellular niche for the survival of a number of important human pathogens. Although KCs have been extensively studied in vitro, little is known of their in vivo response to infection and their capacity to directly interact with antigen-specific CD8(+) T cells. Here, using a combination of approaches including whole mount and thin section confocal microscopy, adoptive cell transfer and intra-vital 2-photon microscopy, we demonstrate that KCs represent the only detectable population of mononuclear phagocytes within granulomas induced by Leishmania donovani infection that are capable of presenting parasite-derived peptide to effector CD8(+) T cells. This restriction of antigen presentation to KCs within the Leishmania granuloma has important implications for the identification of new candidate vaccine antigens and for the design of novel immuno-therapeutic interventions.


Conflict of interest statement

The authors have declared that no competing interests exist.

Figures
Figure 1
Figure 1. Distribution of Leishmania amastigotes in the liver.
C57BL/6 mice were infected with tdTom-L. donovani (A–F) or WT-L. donovani amastigotes (G–I) and 14 days later liver tissue was processed for confocal microscopy. A)–F) Intracellular amastigotes (red) are shown in combination with staining for F4/80 (white) and CD11c (green). A) Low magnification view to show diversity of the granulomatous response. B) High magnification image of single granuloma with macrophages containing numerous amastigotes. C) Infected F4/80+ cells with limited inflammatory cell recruitment. D) CD11c (green) and E) F4/80 (white) expression on amastigote (red) infected cells at the granuloma core. F) overlay of D) and E). G) CD11b+ cells (green) and H) F4/80+ cells (red) were predominantly localised to distinct sites within the granuloma and F4/80+ cells at the core did not express CD11b (I, overlay). DAPI was used as a nuclear counterstain (blue). Scale bars 50 µm for A) and 20 µm for B–F).
Figure 2
Figure 2. Kupffer Cell redistribution as a result of L. donovani infection.
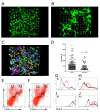
A) Whole mount immuno-histochemistry showing the distribution of F4/80+ (green) KCs in naïve (1 unit  = 23.3 µm) and B) L. donovani infected liver (1 unit  = 19.5 µm). C) Image from A) demonstrating the method used to determine the volume of F4/80 positive cells with Volocity software. D) Comparison of cell volumes of single F4/80+ cells in naïve and non-granuloma associated KC in infected livers (mean ± SEM). E) Hepatic mononuclear cell preparations showing 4 populations of cells based on expression of F4/80 and CD11c from naïve and F) day 14 infected mice. G–J) expression of MHCII on the surface of R1 (G), R2 (H), R3 (I) and R4 (J) populations from naïve (black lines) and infected (red lines) mice. Data is representative of 21 replicates from 5 individual mice.
Figure 3
Figure 3. Recruitment of local Kupffer Cells results in a redistribution of nanobeads.
Distribution of nanobeads (red) in naïve liver following pre-injection showing A) F4/80+ Kupffer cells (green), B) Desmin+ stellate cells (white) and C) CD11b+ monocytes (green). Distribution of nanocrystals (red), in liver of mice pre-injected with NBs and then infected with L. donovani, in D) F4/80+ Kupffer cells (green), E) Desmin+ stellate cells (white) and F) CD11b+ monocytes (green). DAPI was used as a nuclear counterstain (blue). Scale bars for A–F 20 µm.
Figure 4
Figure 4. Expression of MHCI-peptide complexes in the liver.
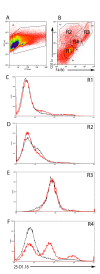
A) Hepatic mononuclear cell suspensions were gated on FSC and SSC and B) CD11c and F4/80 expression to identify 4 different cell populations (R1-4). C) Expression of Kb-SIINFEKL complex as detected by binding of 25-D1.16 on F4/80 CD11c (R1), D) F4/80int CD11chi (R2) E) F4/80hi CD11chi (R3) and F) F4/80int CD11cint (R4) cells from WT L. donovani (black line) or PINK (red line) infected mice. Data is representative of two-independent experiments.
Figure 5
Figure 5. 3D imaging of hepatic granulomas.
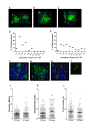
A–C) Snapshots of the 3D view of Z-stacks collected from the livers of d14 L. donovani-infected hCD2.GFP reporter mice showing the T cell content of individual granulomas. Scale A) 24 µm, B) 20 µm C) 15.7 µm. D) Volume distribution for granulomas in the liver of d14 infected (n = 50 granulomas) and E) d25 infected hCD2.GFP reporter mice. (n = 131 granulomas) F–H) Distribution of tdTom L. donovani amastigotes in the liver of d14 infected hCD2.GFP reported mice showing the focal accumulation around some, but not all parasite infected cells. Scale F) 28 µm, G) 16 µm, H) 17.4 µm. I) Enlarged view of parasite infected cell in H) to show resolution of single parasites. J–K) OT-I T cell migration within and outside of granulomas was determined in WT L. donovani infected livers by calculating cell velocity (J) meandering index (K) and track length (L). ** P<0.01 Bars represent mean +/− SEM.
Figure 6
Figure 6. Accumulation of antigen-specific CD8+ T cells within hepatic granulomas.
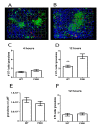
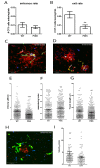
A) Snapshot of the 3D view of Z-stacks collected from the livers of d21 OVA expressing PINK-infected hCD2.GFP reporter mice that received 107 memory-like CMTMR labelled OT-I T cells (red) 4 h or B) 12 h previously. C) Quantification of the number of OT-I T cells located within granulomas from d21 L. donovani infected mice 4 h after transfer (n = 68 granulomas and 81 cells for WT and 76 granulomas, 19 cells for PINK) or D) 12 h after transfer (n = 116 granulomas and 289 cells for WT and 103 granulomas and 491 cells for PINK, ** P<0.001). E) 3D volume of granulomas in the livers of d21 hCD2.GFP mice used in (A–D). F) Number of F5 T cells within the granulomas of d21-infected WT L. donovani- and PINK-infected mice 12 h after transfer (n = 53 granulomas and 81 cells for WT and 57 granulomas and 97 cells for PINK.) Data represents mean ± SEM and is representative of 3 independent experiments.
Figure 7
Figure 7. CD8+ T cell dynamics in the liver following L. donovani infection.
A) The entrance and B) exit rate of CFSE labelled memory-like OT-I T cells 5–14 h post-transfer into d14–21 infected hCD2.GFP mice calculated by dividing the number of OT-I cells entering or leaving each granuloma for each imaging session and dividing by the time of each imaging session to give a rate/min (n = 60 imaging sessions for WT and 71 for PINK infected mice, ** < 0.001). C) Snapshot of the extended focus view of a time-lapse imaging sequence showing the cell tracks of CFSE labelled memory-like OT-I T cells transferred into d14-21 WT L. donovani or D) PINK-infected mice. Comparison of the E) cell velocities, F) meandering index and G) track length of memory-like OT-I T cells transferred into d14-21 WT L. donovani- or PINK-infected mice (n = 266 for WT and 311 for PINK, *** P<0.0001, ** P<0.001). H) Snapshot of the extended focus view of a time-lapse imaging sequence showing the cell tracks of Hoechst labelled memory-like OT-I T cells (blue tracks) and CFSE labelled memory-like F5 cells (green) transferred into d14-21 PINK infected mice. I) Comparison of the cell velocities of memory-like F5 and OT-I T cells transferred into d14-21 PINK-infected mice (n = 105 for F5 and 87 for OT-I T cells). Data represents mean ± SEM, ** P<0.001.
Figure 8
Figure 8. CD8+ T cell interactions with parasite infected cells.
A) Snapshot of the extended focus view of a time-lapse imaging sequence showing transferred memory-like OT-I T cell (green) interactions with nanobead labelled cells (red) in the livers of d14-21 WT L. donovani and B) PINK infected mice. Quantification of C) the percentage and D) the duration of contacts between nanocrystal labelled cells and OT-I T cells in the livers of WT L. donovani and PINK infected mice (n = 57 OT-I cells for WT and 60 OT-I cells for PINK). E) Snapshot of the extended focus view of a time-lapse imaging sequence showing transferred memory-like OT-I T cell (green) interactions with amastigote infected cells (red) in the liver of d14-21 WT L. donovani and F) PINK infected mice. Quantification of G) the percentage and H) the duration of contacts between amastigote-infected cells and OT-I T cells in the livers of WT L. donovani and PINK infected mice, (n = 32 OT-I T cells for WT and 58 OT-I T cells for PINK). Data represents mean ± SEM.

Similar articles

Cited by

References

    1. Tuijnman WB, Van Wichen DF, Schuurman HJ. Tissue distribution of human IgG Fc receptors CD16, CD32 and CD64: an immunohistochemical study. APMIS. 1993;101:319–329. - PubMed
    1. Dominguez-Soto A, Aragoneses-Fenoll L, Gomez-Aguado F, Corcuera MT, Claria J, et al. The pathogen receptor liver and lymph node sinusoidal endotelial cell C-type lectin is expressed in human Kupffer cells and regulated by PU.1. Hepatology. 2009;49:287–296. - PMC - PubMed
    1. Seki E, Brenner DA. Toll-like receptors and adaptor molecules in liver disease: update. Hepatology. 2008;48:322–335. - PubMed
    1. Naito M, Hasegawa G, Ebe Y, Yamamoto T. Differentiation and function of Kupffer cells. Med Electron Microsc. 2004;37:16–28. - PubMed
    1. Klein I, Cornejo JC, Polakos NK, John B, Wuensch SA, et al. Kupffer cell heterogeneity: functional properties of bone marrow derived and sessile hepatic macrophages. Blood. 2007;110:4077–4085. - PMC - PubMed

Publication types

MeSH terms