. 2010;11(3):R33.
doi: 10.1186/gb-2010-11-3-r33. Epub 2010 Mar 15.

Basal core promoters control the equilibrium between negative cofactor 2 and preinitiation complexes in human cells

Affiliations

Basal core promoters control the equilibrium between negative cofactor 2 and preinitiation complexes in human cells

Thomas K Albert et al. Genome Biol. 2010.

Abstract

Background: The general transcription factor TFIIB and its antagonist negative cofactor 2 (NC2) are hallmarks of RNA polymerase II (RNAPII) transcription. Both factors bind TATA box-binding protein (TBP) at promoters in a mutually exclusive manner. Dissociation of NC2 is thought to be followed by TFIIB association and subsequent preinitiation complex formation. TFIIB dissociates upon RNAPII promoter clearance, thereby providing a specific measure for steady-state preinitiation complex levels. As yet, genome-scale promoter mapping of human TFIIB has not been reported. It thus remains elusive how human core promoters contribute to preinitiation complex formation in vivo.

Results: We compare target genes of TFIIB and NC2 in human B cells and analyze associated core promoter architectures. TFIIB occupancy is positively correlated with gene expression, with the vast majority of promoters being GC-rich and lacking defined core promoter elements. TATA elements, but not the previously in vitro defined TFIIB recognition elements, are enriched in some 4 to 5% of the genes. NC2 binds to a highly related target gene set. Nonetheless, subpopulations show strong variations in factor ratios: whereas high TFIIB/NC2 ratios select for promoters with focused start sites and conserved core elements, high NC2/TFIIB ratios correlate to multiple start-site promoters lacking defined core elements.

Conclusions: TFIIB and NC2 are global players that occupy active genes. Preinitiation complex formation is independent of core elements at the majority of genes. TATA and TATA-like elements dictate TFIIB occupancy at a subset of genes. Biochemical data support a model in which preinitiation complex but not TBP-NC2 complex formation is regulated.


Figures

Figure 1
Figure 1
Genome-wide promoter occupancy of TFIIB. (a) TFIIB enrichment on human promoter arrays in two biological ChIP-chip replicates. Each spot represents the median of hybridization intensities obtained on 15 probes per individual promoter region (log2 scale). Pearson's correlation is denoted by r. (b) Signal tracks of the two TFIIB replicates for the HIST1 histone gene cluster and an adjacent BTN butyrophilin gene cluster on chromosome 6. Signals are bar-plotted as ChIP over non-enriched input DNA (ChIP/total) in log2 scale. (c) Resolution of ChIP-chip signals at a single gene promoter. The left panel shows the fragment length distribution of sheared ChIP DNA in the two replicates as determined by ethidium bromide staining of 250 ng (lanes 2 and 4) or 500 ng (lanes 3 and 5) of purified DNA loaded on a 1.4% agarose gel. Lane 1 is a DNA size marker with fragment lengths indicated on the left. The right panel shows magnified signal plots of the two TFIIB replicates at the RNPS1 promoter region. Scale is indicated at the top. The approximate width of the peak area is outlined in red, with the vertical hatched line denoting the peak center. The broken arrow marks the location and direction of the TSS. (d) Average binding profiles of the top 5% probesets for TFIIB replicate 1 (black line) and replicate 2 (grey line) relative to aligned TSSs at 10-bp resolution.
Figure 2
Figure 2
Validation of TFIIB target promoters. (a) Signal distribution of TFIIB enrichment. I, II and III denote groups of promoters from the upper 10th, 60th to 80th, or lower 10th percentile and correspond to high, mid-to-low, or no TFIIB occupancy. (b) Target gene validation. Selected genes from groups I to III were analyzed by ChIP-qPCR using TFIIB or IgG control antibody in a third chromatin sample from LCL721 cells in which two independent ChIP reactions were performed (upper panel). Genes are ordered from left to right according to TFIIB levels on the promoter arrays. The relative ChIP recovery is expressed as percentage of input (y-axis). The bars represent the mean, error bars the range of the two ChIP experiments. Corresponding gene expression levels in LCL721 B cells are shown in the lower panel. These were determined using Affymetrix U133 Plus 2.0 microarrays. They represent normalized hybridization signals of gene-specific microarray probesets. N.A., not analyzed. (c) Assembly of an active PIC at the GAPDH promoter. ChIP-qPCR was conducted with eight primer pairs spanning the human GAPDH locus (numbered boxes in top scheme). Results of ChIPs in LCL721 B cells with antibodies for TFIIB, TBP or the initiating form of RNAPII (CTD S5-P) are graphed as relative occupancy levels at the different amplicon locations (lower panel). (d) Scatter plot showing the genome-wide correlation of TFIIB binding to promoters (x-axis, log2 scale) and steady-state mRNA levels (y-axis, log2 scale) of the corresponding genes. The median of all expression array probesets with present calls is indicated by the dotted horizontal line. The red dots indicate the average expression in gene groups with increasing TFIIB occupancy. They were determined by moving a sliding window (step size 0.1) over the TFIIB data points and calculating the mean expression value for each increment. (e) Distribution of ranked gene expression quantiles (color-coding indicated to the right) in genes with increasing TFIIB occupancy levels. The difference in distributions was statistically evaluated using a Kolmogorov-Smirnov test (***P < 2e-16).
Figure 3
Figure 3
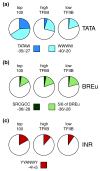
Frequencies of core promoter elements in TFIIB target promoters. Pie charts showing the relative frequencies of (a) TATA and TATA-like motifs, (b) BREu, and (c) INR consensus in the top 100 TFIIB-bound promoters (left chart), high-TFIIB promoters (middle chart) and low-TFIIB promoters (right chart). Motif sequences and positions that were requested for a hit are shown below the charts.
Figure 4
Figure 4
TFIIB versus NC2 binding to human promoters. (a) Genome-wide correlation of TFIIB and NC2 binding levels on promoter regions. r, Pearson's correlation. (b) Pie chart showing the overlap of high-occupancy promoters (upper 10th percentile) recovered in TFIIB and NC2 ChIP-chip samples. (c) Comparison of the frequencies of TATA and BREu consensus sequences in high-TFIIB versus high-NC2 promoters.
Figure 5
Figure 5
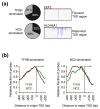
High TFIIB/NC2 ratios select for TATA and combinations of TATA with other core promoter elements. (a) Correlation of TFIIB/NC2 ratio to gene expression. Genes were grouped into percentiles of expression levels (x-axis). For each group, the mean value of TFIIB or NC2 occupancy on all promoters within this group was determined. From these values the ratio was calculated and is plotted as a blue curve in the graph. (b) Nucleotide frequency plots [28] of the top 100 TFIIB-dominated genes (upper panel) or the top 100 NC2-dominated genes (lower panel). Core promoter sequences from position -50 to +50 were extracted and aligned at the TSS (broken arrow). Letter heights reflect relative base frequencies at the given position. Shaded boxes on top of each panel indicate matches to the consensus sequences of core promoter elements shown above. (c) Pie charts depicting the percentage of promoters of either TFIIB-dominated genes or NC2-dominated genes that contain zero, one, two, or three motifs in their core region. (d) Matrix showing absolute frequencies of the indicated core promoter motifs or motif combinations in TFIIB-dominated genes (left) or NC2-dominated genes (right). (e) Synergistic motif combinations in core promoters of TFIIB-dominated genes. The bar graph depicts how often one of the specified reference motifs is found in combination with a second motif in the same promoter. Co-occurrence of two motifs is expressed as fractional percentage, with the reference motif alone set to 100%.
Figure 6
Figure 6
TFIIB/NC2 ratio reflects transcription start site patterns. (a) Start site patterns in TFIIB- versus NC2-dominated genes. Pie charts show the fraction of promoters for which a distinct TSS pattern could be assigned. Individual regions displaying single peak or dominant peak shape were classified as focused TSSs, and those displaying broad or multimodal peak shape were classified as dispersed TSSs (classification following [43]). Examples of genes with focused and dispersed TSS patterns (taken from [44]) are shown. (b) TFIIB profiles (green) and NC2 profiles (red) at promoters of TFIIB-dominated genes (left), or NC2-dominated genes (right). For each profile the relative fraction of high-score (upper 5th percentile) probes mapping to distinct 10 bp bins around the aligned TSS is plotted, with score maxima arbitrarily set to 1.
Figure 7
Figure 7
TFIIB and NC2 binding to TATA (+/-) promoters in nuclear extracts. PICs were formed on immobilized HIV/AdML promoter templates containing a wild-type (wt) or mutant (mt) TATA box using Jurkat nuclear extract under basal conditions (-VP16) or in the presence of the activator Gal4-VP16 (+VP16). After washing, the reactions were analyzed by immunoblotting with specific antibodies against TFIIB or NC2. Blots were scanned and quantified using ImageJ [41]. Bars and error bars represent mean and standard deviation of three independent reactions. TFIIB and NC2 template association is expressed as percentage of relative binding, with the reaction showing maximum binding set to 100%.

Similar articles

Cited by

References

    1. Lifton RP, Goldberg ML, Karp RW, Hogness DS. The organization of the histone genes in Drosophila melanogaster : functional and evolutionary implications. Cold Spring Harb Symp Quant Biol. 1978;42:1047–1051. - PubMed
    1. Smale ST, Baltimore D. The "initiator" as a transcription control element. Cell. 1989;57:103–113. doi: 10.1016/0092-8674(89)90176-1. - DOI - PubMed
    1. Burke TW, Kadonaga JT. Drosophila TFIID binds to a conserved downstream basal promoter element that is present in many TATA-box-deficient promoters. Genes Dev. 1996;10:711–724. doi: 10.1101/gad.10.6.711. - DOI - PubMed
    1. Lewis BA, Kim TK, Orkin SH. A downstream element in the human beta-globin promoter: evidence of extended sequence-specific transcription factor IID contacts. Proc Natl Acad Sci USA. 2000;97:7172–7177. doi: 10.1073/pnas.120181197. - DOI - PMC - PubMed
    1. Deng W, Roberts SG. A core promoter element downstream of the TATA box that is recognized by TFIIB. Genes Dev. 2005;19:2418–2423. doi: 10.1101/gad.342405. - DOI - PMC - PubMed

Publication types

MeSH terms