. 2010 Aug;49(2):210-20.
doi: 10.1016/j.yjmcc.2010.02.021. Epub 2010 Mar 4.

Adiponectin deficiency exacerbates cardiac dysfunction following pressure overload through disruption of an AMPK-dependent angiogenic response

Affiliations

Adiponectin deficiency exacerbates cardiac dysfunction following pressure overload through disruption of an AMPK-dependent angiogenic response

Masayuki Shimano et al. J Mol Cell Cardiol. 2010 Aug.

Abstract

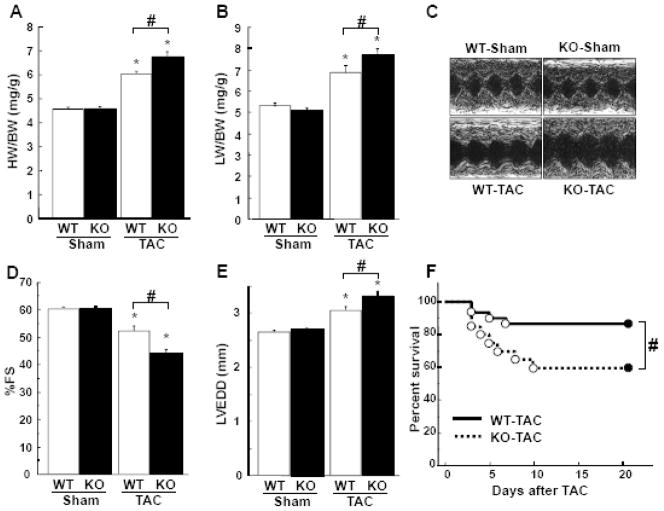
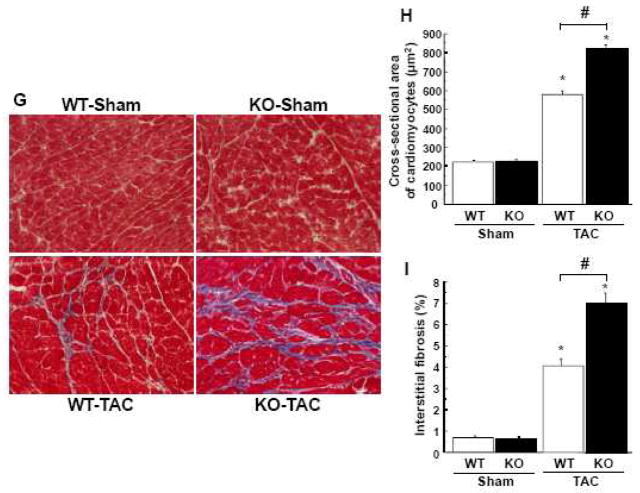
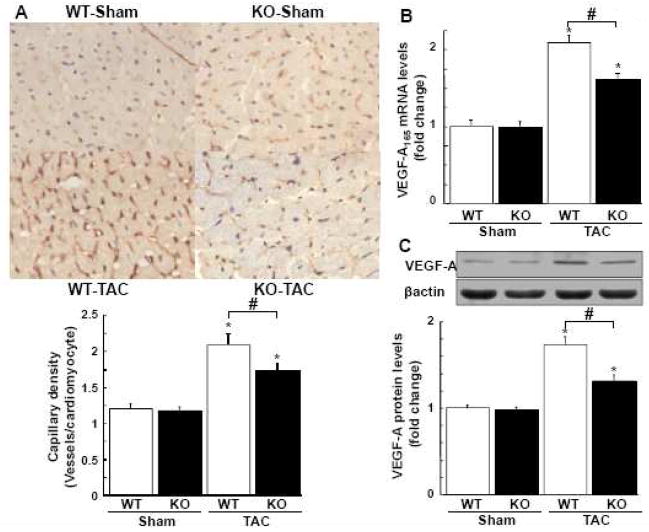
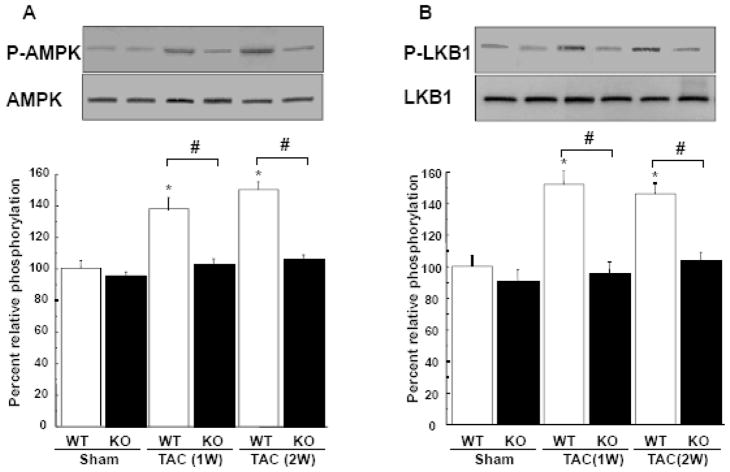
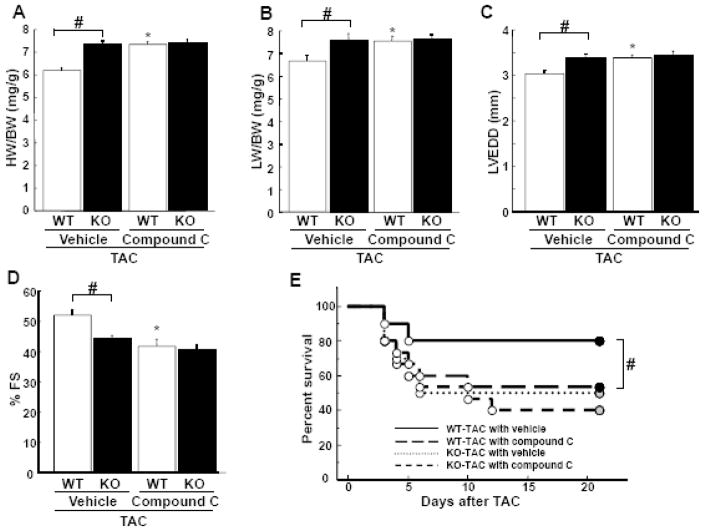
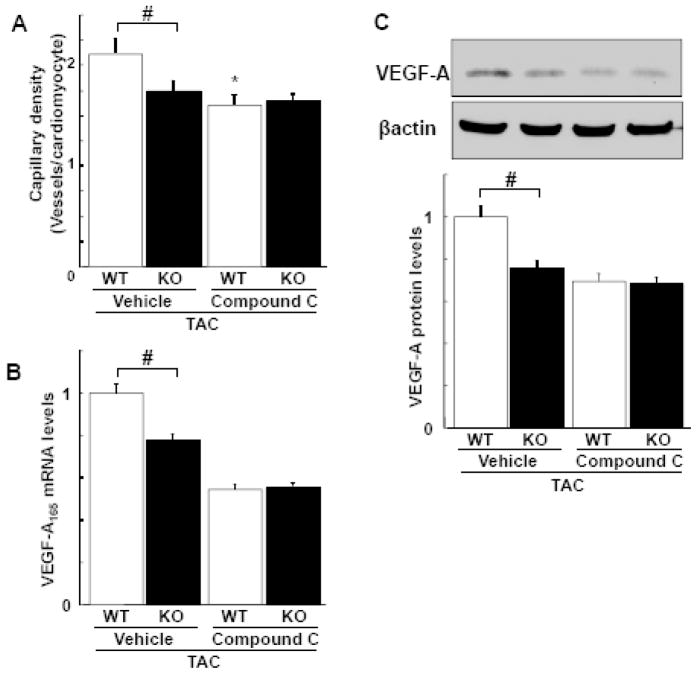
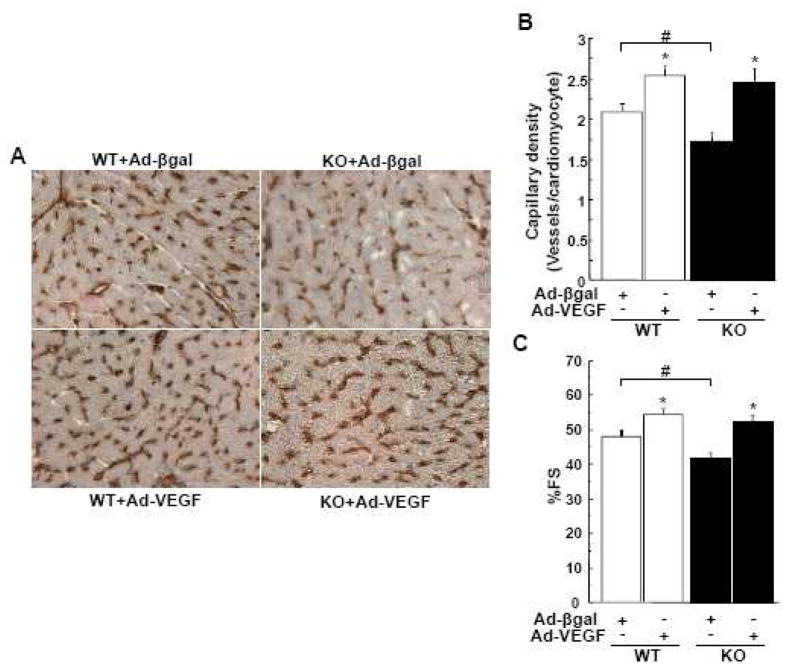
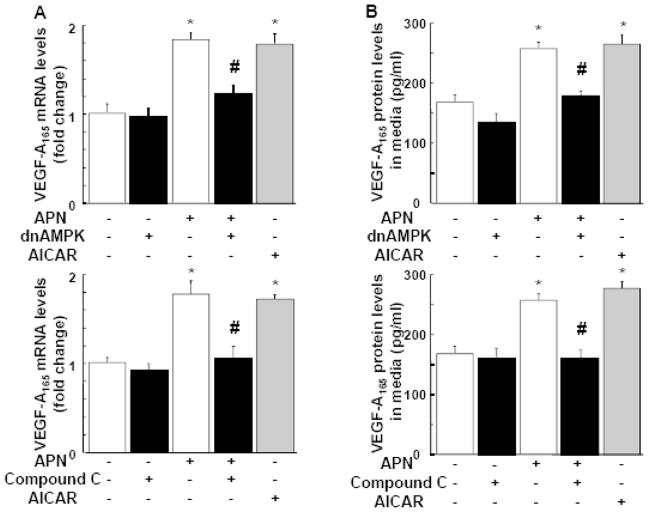
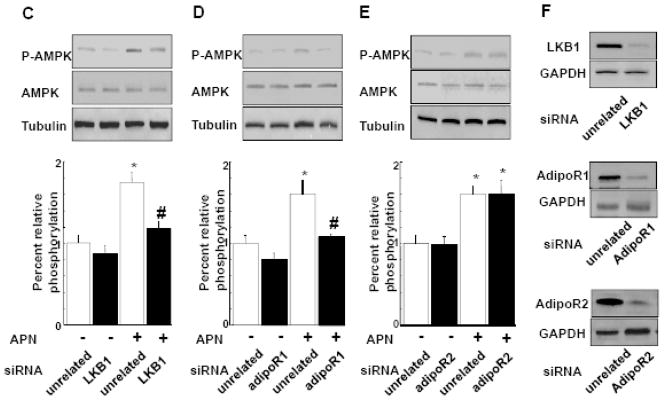
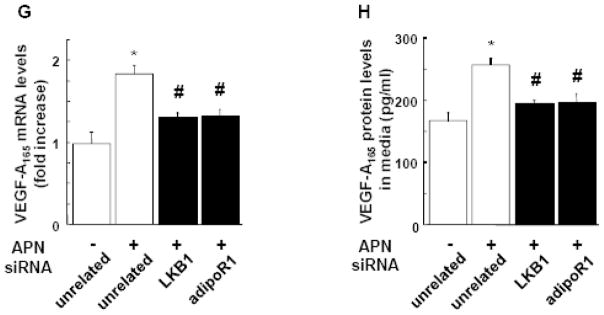
Although increasing evidence indicates that an adipokine adiponectin exerts protective actions on heart, its effects on coronary angiogenesis following pressure overload have not been examined previously. Because disruption of angiogenesis during heart growth leads to contractile dysfunction and heart failure, we hypothesized that adiponectin modulates cardiac remodeling in response to pressure overload through its ability to regulate adaptive angiogenesis. Adiponectin-knockout (APN-KO) and wild-type (WT) mice were subjected to pressure overload caused by transverse aortic constriction (TAC). APN-KO mice exhibited greater cardiac hypertrophy, pulmonary congestion, left ventricular (LV) interstitial fibrosis and LV systolic dysfunction after TAC surgery compared with WT mice. APN-KO mice also displayed reduced capillary density in the myocardium after TAC, which was accompanied by a significant decrease in expression of vascular endothelial growth factor (VEGF) and phosphorylation of AMP-activated protein kinase (AMPK). Inhibition of AMPK in WT mice resulted in aggravated LV systolic function, attenuated myocardial capillary density and decreased VEGF expression in response to TAC. The adverse effects of AMPK inhibition on cardiac function and angiogenic response following TAC were diminished in APN-KO mice relative to WT mice. Moreover, adenovirus-mediated VEGF delivery reversed the TAC-induced deficiencies in cardiac microvessel formation and ventricular function observed in the APN-KO mice. In cultured cardiac myocytes, adiponectin treatment stimulated VEGF production, which was inhibited by inactivation of AMPK signaling pathway. Collectively, these data show that adiponectin deficiency can accelerate the transition from cardiac hypertrophy to heart failure during pressure overload through disruption of AMPK-dependent angiogenic regulatory axis.


Figures

Figure 1
Figure 1. Loss of adiponectin results in exacerbation of pressure overload induced cardiac hypertrophy and heart failure
A and B, The ratio of heart weight to body weight (HW/BW)(A) and lung weight to body weight (LW/BW)(B) in wild-type (WT) and adiponectin-knockout (KO) mice at 3 weeks after sham operation or TAC. C, Representative M-mode echocardiograms for WT or KO mice at 3 weeks after sham or TAC surgery. D and E, Echocardiographic analysis of the fractional shortening (FS)(D) and LV end systolic diameter (LVEDD)(E) for WT and KO mice at 3 weeks after sham operation or TAC. F, Kaplan-Meier survival analysis of WT and KO mice following TAC. G, Representative histological LV sections from WT and KO mice stained with Masson Trichrome. Heart samples were collected at 3 weeks after sham operation or TAC. Magnification, ×400. H and I, Quantitative analysis of the cross-sectional area of cardiomyocytes (H) and the intestinal fibrosis area (I) from each group. Results are presented as mean ± SEM (n=10 to 15 per each group). *P<0.05 versus corresponding sham and #P<0.05 versus corresponding WT mice.
Figure 2
Figure 2. Adiponectin-deficiency causes decreased cardiac angiogenesis and VEGF expression following pressure overload
A, Representative images of CD31-stained heart sections from WT and KO mice at 3 weeks after sham operation or TAC in. Brown indicates CD31-positive cells, whereas light purple indicates nuclei in the hematoxylin stain. Magnification, ×400. Lower panel shows quantitative analysis of capillary density by measuring the number of CD31-positive cells per cardiomyocyte from each group. B, VEGF-A165 mRNA levels in the myocardium of WT and KO mice at 2 weeks after sham operation or TAC. VEGF-A165 mRNA levels were quantified by QRT-PCR analysis and presented relative to levels of GAPDH. C, Myocardial expression of VEGF-A protein in WT and KO mice at 2 weeks after sham operation or TAC. VEGF protein levels were determined by western blot analysis. Representative VEGF-A bands with corresponding β-actin bands are shown. Band intensities were normalized to sham operated WT mice. Lower panel shows quantitative analysis of VEGF-A protein levels. Results are shown as mean ± SEM (n=8 in each group). *P<0.05 versus corresponding Sham and #P<0.05 versus WT mice.
Figure 3
Figure 3. Loss of adiponectin contributes to attenuated phosphorylation of AMPK and LKB1 after TAC
A and B, Changes in phosphorylation of AMPK (P-AMPK)(A) and LKB1 (P-LKB1)(B) in the hearts of WT and KO mice at 1 or 2 weeks after sham operation or TAC. Representative blots of phosphorylated and total LKB1 and AMPK are shown. Lower panels show quantitative analysis of LKB1 and AMPK phosphorylation. Relative phosphorylated levels of LKB1 and AMPK were normalized to control values in sham-WT mice (n=4–8 hearts in each group). *P<0.05 versus corresponding sham and #P<0.05 versus WT mice.
Figure 4
Figure 4. Effect of AMPK inhibition on cardiac remodeling in WT and APN-KO mice subjected to TAC
A and B, The ratio of heart weight to body weight (HW/BW)(A) and lung weight to body weight (LW/BW) in WT and KO mice in the presence of compound C or vehicle at 3 weeks after TAC. C and D, Echocardiographic analysis of the fractional shortening (FS)(C) and LV end systolic diameter (LVEDD)(D) for WT and KO mice treated with compound C or vehicle at 3 weeks after sham operation or TAC. E, Kaplan-Meier survival analysis of WT and KO mice in the presence of compound C or vehicle following TAC. Results are presented as mean ± SEM (n=10 to 15 per each group). *P<0.05 versus corresponding vehicle-treated mice and #P<0.05 versus corresponding WT mice.
Figure 5
Figure 5. Effect of AMPK inhibition on capillary density and VEGF expression in response to pressure overload in WT and APN-KO mice
A, Quantitative analysis of capillary density in the myocardium from WT and KO mice in the presence of compound C and vehicle at 3 weeks after TAC. Capillary density was determined by the number of CD31-positive cells per cardiomyocyte. B, VEGF-A165 mRNA levels in the hearts of WT and KO mice in the presence of compound C and vehicle at 2 weeks after TAC. VEGF-A165 mRNA levels were determined by QRT-PCR. C, Myocardial expression of VEGF-A protein in WT and KO mice in the presence of compound C and vehicle at 2 weeks after TAC as measured by western blot analysis. Representative blots for VEGF-A and β-actin are shown. Band intensities were normalized to vehicle-treated WT mice. Results are shown as mean ± SEM (n=8 in each group). *P<0.05 versus corresponding vehicle treatment and #P<0.05 versus WT mice.
Figure 6
Figure 6. Adenovirus mediated VEGF delivery reverses cardiac dysfunction in adiponectin deficient mice following pressure overload
A, Representative images of CD31-stained heart sections from WT and KO mice treated with Ad-VEGF or Ad-βgal at 3 weeks after TAC in. Brown indicates CD31-positive endothelial cells, whereas light purple indicates nuclei in the hematoxylin stain. Magnification, ×400. B, Quantitative analysis of capillary density by measuring the number of CD31-positive cells per cardiomyocyte from each group. C, Echocardiographic analysis of the fractional shortening (FS) for WT and KO mice treated with Ad-VEGF or Ad-βgal at 3 weeks after TAC. Results are presented as mean ± SEM (n=4–7 per each group). *P<0.05 versus corresponding Ad-βgal treated mice and # P<0.05 versus corresponding WT mice.
Figure 7
Figure 7. Adiponectin stimulates VEGF production in cultured cardiac myocytes through AMPK signaling
A and B, Effect of adiponectin on VEGF-A165 mRNA (A) and VEGF-A protein (B) levels in cardiomyocytes. Neonatal rat ventricular myocytes (NRVMs) were transduced with adenoviral vector expressing dominant-negative AMPK (dn-AMPK) or an adenoviral vector expressing β-galactosidase (βgal, control) for 16 hours, and then treated with adiponectin (APN, 30μg/ml) or vehicle for 24 hours. In some conditions, NRVMs were treated with compound C (20μM) prior to treatment with APN or vehicle. Treatment with AICAR (2uM) was used as a positive control. VEGF-A165 mRNA levels were measured by QRT-PCR methods. VEGF-A165 protein levels in the cell culture media were assessed by ELISA. Contribution of LKB1 (C), AdipoR1 (D) and AdipoR2 (E) to adiponectin-induced AMPK activation. NRVMs were transfected with siRNA targeting LKB1, AdipoR1 or AdipoR2, or unrelated siRNAs for 48 hours followed by stimulation with adiponectin (APN) or vehicle for 30 min. AMPK phosphorylation was assessed by western blot analysis. Representative blots are shown in upper panels. Lower panels show quantitative analysis of AMPK phosphorylation. (F) Representative immunoblots documenting knock-down of LKB1, AdipoR1 and AdipoR2 following treatment with specific and unrelated control siRNA. Effect of knockdown of AdipoR1 or LKB1 on adiponectin-induced VEGF-A165 mRNA (G) and protein (H) levels. After transfection with siRNA against LKB1 or AdipoR1, or unrelated siRNAs, NRVMs were treated with adiponectin or vehicle for 24 hours. *P<0.05 versus corresponding control and #P<0.05 versus adiponectin treatment.

Similar articles

Cited by

References

    1. Levy D, Garrison RJ, Savage DD, Kannel WB, Castelli WP. Prognostic implications of echocardiography determined left ventricular mass in the Framingham Heart Study. N Engl J Med. 1990;322:1561–6. - PubMed
    1. Frey N, Katus HA, Olson EN, Hill JA. Hypertrophy of the heart: a new therapeutic target? Circulation. 2004;109:1580–9. - PubMed
    1. Luedde M, Katus HA, Frey N. Novel molecular targets in the treatment of cardiac hypertrophy. Recent Pat Cardiovasc Drug Discov. 2006;1:1–20. - PubMed
    1. Izumiya Y, Shiojima I, Sato K, Sawyer DB, Colucci WS, Walsh K. Vascular endothelial growth factor blockade promotes the transition from compensatory cardiac hypertrophy to failure in response to pressure overload. Hypertension. 2006;47:887–93. - PMC - PubMed
    1. Shiojima I, Sato K, Izumiya Y, Schiekofer S, Ito M, Liao R, et al. Disruption of coordinated cardiac hypertrophy and angiogenesis contributes to the transition to heart failure. J Clin Invest. 2005;115:2108–18. - PMC - PubMed

Publication types

MeSH terms

Substances