. 2010 Feb 26:4:6.
doi: 10.3389/neuro.04.006.2010. eCollection 2010.

Membrane targeted horseradish peroxidase as a marker for correlative fluorescence and electron microscopy studies

Affiliations

Membrane targeted horseradish peroxidase as a marker for correlative fluorescence and electron microscopy studies

Jianli Li et al. Front Neural Circuits. .

Abstract

Synaptic dynamics and reorganization are fundamental features of synaptic plasticity both during synaptic circuit development and in the mature CNS underlying learning, memory, and experience-dependent circuit rearrangements. Combining in vivo time-lapse fluorescence imaging and retrospective electron microscopic analysis provides a powerful technique to decipher the rules governing dynamics of neuronal structure and synaptic connections. Here we have generated a membrane-targeted horseradish peroxidase (mHRP) that allows identification of transfected cells without obscuring the intracellular ultrastructure or organelles and in particular allows identification of synaptic sites using electron microscopy. The expression of mHRP does not affect dendritic arbor growth or dynamics of transfected neurons. Co-expression of EGFP and mHRP was used to study neuronal morphology at both the light and electron microscopic levels. mHRP expression greatly facilitates 3D reconstruction based on serial EM sections. We expect this reagent will be valuable for studying the mechanisms that guide construction of neuronal networks.

Keywords: 3D reconstruction; Xenopus laevis; horseradish peroxidase; synapse; time-lapse imaging; ultrastructure.


Figures
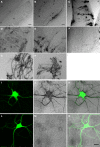
Figure 1
Figure 1
HRP constructs and their expression in cells. Micrographs of vibratome sections through the optic tectum of Xenopus tadpoles in which DAB reactions are used to visualize constructs generated with cDNA from HRP and other proteins as specified: (A) cytosolic HRP. (B) EGFP/ssHRP. (C) EGFP/ssHRPKDEL. (D) EGFP/ssHRP-TM-GFP. (E,F) EGFP/ssHRP-TM. (G) EGFP/ssHRP-XIRbeta-TM. (H) ssHRP-TM-synaptophysin-EGFP. Plasmid definitions are shown in Table 1. (I–N) Expression of mHRP in hippocampal neurons. (I–K) A hippocampal neuron, transfected with EGFP/mHRP. (I) EGFP expression. (J) The mHRP was revealed by DAB reaction. (K) Merge of EGFP and DAB signal. (L,N) A hippocampal neuron, transfected with EGFP only, showed no DAB signal. (L) EGFP expression. (M) Image following DAB reaction. (N) Merge of EGFP and DAB signal. Scale bars in (A) and (B) are 20 μm. Scale bar in (C) is 10 μm and applies to (D–H). Scale bar in (N) is 20 μm and also applies to (I–M).
Figure 2
Figure 2
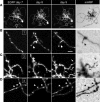
mHRP and EGFP are detected throughout the fine structure of transfected neurons. (A) Two-photon images of a neuron expressing both EGFP and mHRP were collected once a day over 9 days. The right column shows the same mHRP-labeled neuron revealed by DAB reaction. (B–D) High magnification of insets (B–D) in (A) demonstrated that stable (B) and extended (C) dendritic branches and axonal boutons (D) can be detected equally well by both EGFP and mHRP expression. Scale bar: 20 μm in (A), 5 μm in (B), which applies to (C) and (D).
Figure 3
Figure 3
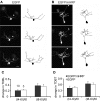
Expression of mHRP does not affect dendritic arbor growth. (A,B) Two-photon time-lapse images were collected every 4 h over 8 h 2 days after single-cell electroporation of EGFP (A) or co-expressed EGFP and mHRP (B). Drawings of the neurons from complete 3D reconstructions of two-photon imaging stacks are shown to the right of the two-photon images. The axons are marked by white arrowheads in the images. (C,D) Neurons expressing EGFP and mHRP (black bars) have same dendrite growth rates as EGFP-expressing neurons (white bars) when assayed for changes in total dendritic branch length or total dendritic branch tip number. Scale bar in (A) is 20 μm.
Figure 4
Figure 4
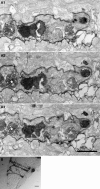
mHRP labels the plasma membrane and endocytosed membrane of glial cells. (A1–A3) Micrographs from serial EM sections show the ultrastructure of processes from an mHRP-labeled radial glial cell. Labeled multivesicular organelles are marked as stars. (B) Vibratome section (60 μm) showing mHRP-labeled radial glial cells in the optic tectum. Scale bar: 20 μm in (A1A3), 1 μm in (B).
Figure 5
Figure 5
Ultrastructure of an EGFP/mHRP labeled neuron. (A) Two-photon image of an optic tectal neuron which was labeled by single cell electroporation with co-expressed EGFP and mHRP. (B) mHRP distribution in a vibratome section through the same neuron. The distribution of mHRP was revealed by DAB reaction. (C) Low magnification image of an electron micrograph showing the location of the mHRP-labeled cell body and dendritic process in different layers within the optic tectum. The cell body layer is toward the left and the neuropil layer is to the right. (D) High magnification of an electron micrograph shows the ultrastructural morphology of the labeled cell body (blue) in (C) (large black box) and the nucleus (pink). (E1–E3) Serial electron micrographs through a labeled distal dendritic branch (blue) in (C) (small black box) show two synaptic contacts (from pink axon terminals and marker with white arrow heads). Note that the axon terminal on right which contacts the mHRP-labeled dendrite also contacts another unlabeled postsynaptic profile (white arrow). (F1–F3) Serial electron micrographs show that a labeled major dendritic branch (blue) was contacted by two presynaptic terminals (pink, white arrow heads). Scale bars are 10, 2, and 1 μm in (C,D,E). Scale bar in (E1–E3) also applies to (F1–F3).
Figure 6
Figure 6
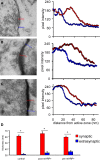
Criteria to identify synaptic contacts. (A–C) Electron micrographs on the left show synaptic contact in control tissue (A), synapse with postsynaptic profiles labeled by mHRP (B), synapse with presynaptic profiles labeled by mHRP (C). Synapses are identified according to the presence of clustered synaptic vesicles opposed to the membrane of one profile in at least two serial sections. Measurements of pixel intensities taken from the locations of the red and blue lines, which mark synaptic and extrasynaptic sites (histograms on right of each image) provide an independent means to identify synaptic sites. Note that the thickness of the electron dense membrane and cleft is consistently greater at synaptic sites than at extrasynaptic sites. The average thickness at extrasynaptic sites in the pre mHRP+ samples is significantly greater than controls (p < 0.05), likely due to distribution of DAB label. White arrows in (C) mark recycled synaptic vesicles labeled by mHRP (see text for details). (D) The thickness at synaptic and extrasynaptic sites analyzed from tissues represented in panels (A–C). *p < 0.01.
Figure 7
Figure 7
mHRP labeling facilitates 3D reconstruction of identified axons. (A1–A3) Serial EM sections show the morphology of a fine axon shaft cut in cross section. (B1–B3) Serial EM sections show ultrastructural morphology of synaptic contacts (white arrow heads). Note that mHRP-labeled synaptic vesicles are shown in the presynaptic terminal (white arrows). (C) 3D reconstruction of a segment of an mHRP-labeled axon branch. Red dots represent the central locations of postsynaptic densities. Blue dots represented mHRP-labeled synaptic vesicles. Top arrow in C marks the location of the sections in (A) and bottom arrow marked the synaptic bouton reconstructed from sections shown in (B). Scale bar in (A) is 500 nm and also applies to (B). Scale box in (C) is 1 μm.

Similar articles

Cited by

References

    1. Ahmari S. E., Buchanan J., Smith S. J. (2000). Assembly of presynaptic active zones from cytoplasmic transport packets. Nat. Neurosci. 3, 445–45110.1038/74814 - DOI - PubMed
    1. Anderson J. C., Dehay C., Friedlander M. J., Martin K. A., Nelson J. C. (1992). Synaptic connections of physiologically identified geniculocortical axons in kitten cortical area 17. Proc. Biol. Sci. 250, 187–19410.1098/rspb.1992.0148 - DOI - PubMed
    1. Bestman J. E., Ewald R. C., Chiu S. L., Cline H. T. (2006). In vivo single-cell electroporation for transfer of DNA and macromolecules. Nat. Protoc. 1, 1267–127210.1038/nprot.2006.186 - DOI - PubMed
    1. Bishop D. L., Misgeld T., Walsh M. K., Gan W. B., Lichtman J. W. (2004). Axon branch removal at developing synapses by axosome shedding. Neuron 44, 651–66110.1016/j.neuron.2004.10.026 - DOI - PubMed
    1. Campbell G., Shatz C. J. (1992). Synapses formed by identified retinogeniculate axons during the segregation of eye input. J. Neurosci. 12, 1847–1858 - PMC - PubMed