. 2010 Mar 3;30(9):3326-38.
doi: 10.1523/JNEUROSCI.5098-09.2010.

Amyloid-beta aggregates cause alterations of astrocytic metabolic phenotype: impact on neuronal viability

Affiliations

Amyloid-beta aggregates cause alterations of astrocytic metabolic phenotype: impact on neuronal viability

Igor Allaman et al. J Neurosci. .

Abstract

Amyloid-beta (Abeta) peptides play a key role in the pathogenesis of Alzheimer's disease and exert various toxic effects on neurons; however, relatively little is known about their influence on glial cells. Astrocytes play a pivotal role in brain homeostasis, contributing to the regulation of local energy metabolism and oxidative stress defense, two aspects of importance for neuronal viability and function. In the present study, we explored the effects of Abeta peptides on glucose metabolism in cultured astrocytes. Following Abeta(25-35) exposure, we observed an increase in glucose uptake and its various metabolic fates, i.e., glycolysis (coupled to lactate release), tricarboxylic acid cycle, pentose phosphate pathway, and incorporation into glycogen. Abeta increased hydrogen peroxide production as well as glutathione release into the extracellular space without affecting intracellular glutathione content. A causal link between the effects of Abeta on glucose metabolism and its aggregation and internalization into astrocytes through binding to members of the class A scavenger receptor family could be demonstrated. Using astrocyte-neuron cocultures, we observed that the overall modifications of astrocyte metabolism induced by Abeta impair neuronal viability. The effects of the Abeta(25-35) fragment were reproduced by Abeta(1-42) but not by Abeta(1-40). Finally, the phosphoinositide 3-kinase (PI3-kinase) pathway appears to be crucial in these events since both the changes in glucose utilization and the decrease in neuronal viability are prevented by LY294002, a PI3-kinase inhibitor. This set of observations indicates that Abeta aggregation and internalization into astrocytes profoundly alter their metabolic phenotype with deleterious consequences for neuronal viability.


Figures
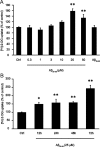
Figure 1.
Figure 1.
Aβ causes a concentration- and time-dependent increase in glucose utilization. A, Astrocytes were stimulated with Aβ25-35 (0.3, 1, 3, 10, 25, or 50 μm) or Aβ35-25 (25 μm) for 48 h and glucose utilization was determined using the [3H]-2-DG technique. [3H]-2-DG uptake in the control (Ctrl) group was 89.8 ± 12.0 fmol/dish. B, Astrocytes were stimulated with Aβ25-35 (25 μm) for 12, 24, 48, or 72 h and glucose utilization was determined using the [3H]-2-DG technique. [3H]-2-DG uptake in the Ctrl group was 73.8 ± 5.6 fmol/dish. Results obtained in A and B are expressed as percentage of Ctrl values and are means of at least eight determinations from three independent experiments. Data were statistically analyzed with ANOVA followed by Dunett's test (**p < 0.01 vs Ctrl; *p < 0.05 vs Ctrl).
Figure 2.
Figure 2.
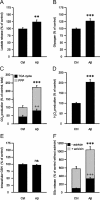
Effects of Aβ on astrocyte metabolism. A–F, Astrocytes were stimulated with 25 μm25-35 for 48 h and the following metabolic parameters were evaluated: A, Lactate release. Results are expressed as percentage of control (Ctrl) values (140.1 ± 15.2 nmol/dish) and are means ± SEM of at least 23 determinations from at least eight independent experiments. B, Glycogen levels. Results are expressed as percentage of Ctrl values (35.9 ± 2.2 nmol/ dish) and are means ± SEM of at least 12 determinations from at least four independent experiments. C, CO2 production in the PPP and the TCA cycle. Results are expressed as percentage of Ctrl values for the total production of CO2 (0.0302 ± 0.0075 nmol of CO2 per dish per min) and are means ± SEM of at least six determinations from at least three independent experiments. D, Hydrogen peroxide production. Results are expressed as percentage of Ctrl values (0.75 ± 0.08 μm) and are means ± SEM of at least 20 determinations from at least four independent experiments. E, Intracellular glutathione (GSH) content. Results are expressed as percentage of Ctrl values (17.1 ± 1.3 nmol/dish) and are means ± SEM of 12 determinations from four independent experiments. F, Extracellular glutathione (GSx) content. When indicated, the γ-glutamyl-transpeptidase inhibitor acivicin (100 μm) was added 1 h before Aβ25-35 and maintained throughout the whole incubation. Results are expressed as percentage of Ctrl values without acivicin (0.76 ± 0.12 nmol/dish) and are means ± SEM of at least eight determinations from at least three independent experiments. All data were statistically analyzed with t test (** and ++p < 0.01; *** and +++p < 0.001; ns, not significantly different from Ctrl). For C and F, asterisks refer to total CO2 production and acivicin conditions, respectively; cross marks refer to CO2 production in TCA cycle and basal condition (without acivicin), respectively.
Figure 3.
Figure 3.
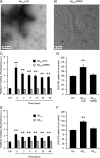
Effect of the aggregation state of amyloid peptides on glucose utilization. A, B, Aggregation state was assessed by EM. Aβ25-35 was first dissolved as stock solution in deionized water (A) or in DMSO (B) and then diluted to a final concentration of 25 μm in deionized water. After 4 h of incubation at 37°C, 5 μl aliquots were processed for EM and observed. Scales are shown in the lower left corner. The pictures exhibited here are representative examples of three independent sets of experiments. C, E, Thioflavin T binding assay. Aβ25-35 was first dissolved in deionized water or DMSO as above (C) and Aβ1-42 or Aβ1-40 peptides were dissolved in deionized water (E). The peptides were then diluted to the final working concentration, 25 μm for Aβ25-35 and 6 μm for Aβ1-42 and Aβ1-40, in the culture medium and incubated in culture conditions for different times. Aliquots of the medium were used to determine amyloid aggregation state using thioflavin T binding assay. A sample of pure culture medium was used as the control (Ctrl). Results are expressed as fluorescence arbitrary units and are means ± SEM of at least nine determinations from at least three independent experiments. D, F, Effect on glucose utilization. Astrocyte cultures were exposed for 48 h to 25 μm25-35 initially dissolved in deionized water (Aβ25-35/H2O) or DMSO (Aβ25-35/DMSO) (D) or to 6 μm1-42 or Aβ1-40 initially dissolved in deionized water (F). Glucose utilization was determined using the [3H]-2-DG technique. Results are expressed as percentage of Ctrl values (59.9 ± 4.7 fmol/dish for D and 59.0 ± 5.1 fmol/dish for F) and are means ± SEM of at least seven determinations from three independent experiments. Data obtained in CF were statistically analyzed with ANOVA followed by Dunett's test (**p < 0.01 vs Ctrl).
Figure 4.
Figure 4.
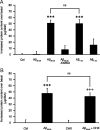
Effects of Aβ peptides on the cellular protein content. A, Isoform specificity. Astrocyte cultures were exposed to Aβ35-25 (25 μm), Aβ25-35 (25 μm), Aβ1-40 (6 μm), Aβ1-42 (6 μm) (stock solutions in water), or Aβ25-35 (25 μm) (stock solution in DMSO) (Aβ25-35/DMSO) for 48 h and cell protein content was determined using the BCA assay. Results are expressed as the difference in micrograms from the mean protein content of control (Ctrl) values and are means ± SEM of at least seven determinations from three independent experiments. Data were statistically analyzed with ANOVA followed by Bonferroni's test (***p < 0.001 vs Ctrl; ns, not significantly different from Aβ25-35; p < 0.001 for Aβ25-35 vs Aβ25-35/DMSO and for Aβ1-42 vs Aβ1-40). The mean protein content in the Ctrl condition was 200.4 ± 12.6 μg/dish. B, Independency of de novo protein synthesis. Astrocyte cell cultures were exposed to Aβ25-35 (25 μm) in presence or absence of CHX (10 μm) for 24 h. When indicated, CHX was added 1 h before amyloid peptide and maintained throughout the entire incubation. Cell protein content was then determined using the BCA assay. Results are expressed as the difference in micrograms from the mean protein content of the respective basal conditions (Ctrl or CHX) and are means ± SEM of at least eight determinations from three independent experiments. Data were statistically analyzed with ANOVA followed by Bonferroni's test (***p < 0.001 vs Ctrl; +++p < 0.001 vs CHX; ns, not significantly different from Aβ25-35). The mean protein content in basal conditions were: 230.9 ± 27.6 μg/dish (Ctrl) and 196.5 ± 22.0 μg/dish (CHX).
Figure 5.
Figure 5.
Inhibition of Aβ internalization by the SR-A receptor agonist poly(I). AD, Astrocyte cultures were exposed to 6 μm FITC-labeled Aβ1-42 for 2 h (A, B, C) or to 25 μm25-35 for 24 h (D), in the presence or absence of 500 μg/ml poly(I) or poly(C). When indicated, poly(I) and poly(C) were added 1 h before amyloid peptide and maintained during the entire incubation period. A, Internalization of FITC-Aβ1-42 in green demonstrated by confocal microscopy using DiD for cell-membrane-labeling (here in red). B, C, Poly(I) completely inhibited FITC-Aβ1-42 internalization (B), whereas poly(C) was without effect (C). At the bottom and the right of pictures (A, B, C), in an orthogonal view, are cross sections of the x and y axes to the z axis, demonstrating that green dots are inside cells (cell membrane in red). Scales are shown in the lower left corner of the pictures (5 μm for A; 10 μm for B and C). D, Inhibition of protein accumulation. Cell protein content was determined using the BCA assay. Results are expressed as difference in micrograms from the mean protein content of the respective basal conditions [control (Ctrl), poly(I) and poly(C)] and are means ± SEM of at least eight determinations from three independent experiments. Data were statistically analyzed with ANOVA followed by Bonferroni's test [***p < 0.001 vs respective basal conditions, Ctrl and poly(C); *p < 0.05 vs poly(I); +p < 0.05 vs Aβ25-35; ns, not significantly different from Aβ25-35]. In this set of experiments the mean protein content in basal conditions were as follows: 109.0 ± 7.7 μg/dish (Ctrl), 81.7 ± 5.4 μg/dish [poly(I)], and 85.0 ± 11.7 μg/dish [poly(C)].
Figure 6.
Figure 6.
Signaling cascades involved in the stimulation of glucose utilization by Aβ. Astrocytes were stimulated with 25 μm25-35 for 24 h and glucose utilization was determined using the [3H]-2-DG technique. When indicated, U0126 (20 μm), SB202190 (20 μm), and LY294002 (10 μm), inhibitors of the p42/44 MAP kinase, p38 MAP kinase and the PI3-kinase cascades, respectively, were added 30 min before Aβ25-35 and maintained throughout the whole incubation. Results are expressed as percentage of control (Ctrl) values (60.9 ± 5.7 fmol/dish) and are means ± SEM of at least eight determinations from three independent experiments. Data were statistically analyzed with ANOVA followed by Bonferroni's test (***p < 0.001 vs respective basal conditions, Ctrl, U0126, and SB202190; ns, not significantly different from LY294002; U0126, SB202190, and LY294002, not significantly different from Ctrl).
Figure 7.
Figure 7.
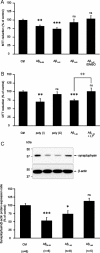
Impact of amyloid peptide treatment in astrocytes on neuronal viability in coculture. AC, Astrocytes were stimulated with Aβ25-35 (25 μm), Aβ1-40 (10 μm), Aβ1-42 (10 μm), poly(I) (500 μg/ml), or poly(C) (500 μg/ml) (stock solutions in water) or with Aβ1-42 (10 μm) (stock solution in DMSO) (Aβ1-42/DMSO) for 24 h. Cells were then rinsed and the coculture was initiated by adding neurons seeded on glass coverslips on top of the astrocytic layer. Twenty-four hours later neuronal viability was determined using the MTT reduction assay (A, B) or neuronal proteins were harvested and synaptophysin expression was assessed by Western blotting (C). A, Isoform and structure dependency. Results are expressed as percentage of control (Ctrl) values and are means ± SEM of at least eight determinations from three independent experiments. B, Implication of SR-A receptors and the PI3-kinase cascade. When indicated, 10 μm LY294002 (LY) was added 1 h before and maintained throughout the whole incubation with Aβ1-42. Results are expressed as percentage of Ctrl values and are means ± SEM of at least 11 determinations from four independent experiments. C, Impact of amyloid peptides pretreatment in astrocytes on neuronal synaptophysin expression in cocultures. Representative Western blot bands are shown. Optical density measurements were used for quantification and values for synaptophysin were normalized using the corresponding β-actin value for each lane. Results are expressed as percentage of Ctrl values and are means ± SEM of at least five determinations from at least three independent experiments. Data obtained in AC were statistically analyzed with ANOVA followed by Bonferroni's test (***p < 0.001 vs Ctrl; **p < 0.01 vs Ctrl; *p < 0.05 vs Ctrl; ++p < 0.01 vs Aβ1-42; ns, not significantly different from Ctrl).

Similar articles

Cited by

References

    1. Abramov AY, Canevari L, Duchen MR. β-Amyloid peptides induce mitochondrial dysfunction and oxidative stress in astrocytes and death of neurons through activation of NADPH oxidase. J Neurosci. 2004;24:565–575. - PMC - PubMed
    1. Akiyama H, Mori H, Saido T, Kondo H, Ikeda K, McGeer PL. Occurrence of the diffuse amyloid beta-protein (Abeta) deposits with numerous Abeta-containing glial cells in the cerebral cortex of patients with Alzheimer's disease. Glia. 1999;25:324–331. - PubMed
    1. Alarcon R, Fuenzalida C, Santibanez M, von Bernhardi R. Expression of scavenger receptors in glial cells: comparing the adhesion of astrocytes and microglia from neonatal rats to surface-bound beta-amyloid. J Biol Chem. 2005;280:30406–30415. - PubMed
    1. Allaman I, Pellerin L, Magistretti PJ. Glucocorticoids modulate neurotransmitter-induced glycogen metabolism in cultured cortical astrocytes. J Neurochem. 2004;88:900–908. - PubMed
    1. Bahia PK, Rattray M, Williams RJ. Dietary flavonoid (-)epicatechin stimulates phosphatidylinositol 3-kinase-dependent anti-oxidant response element activity and up-regulates glutathione in cortical astrocytes. J Neurochem. 2008;106:2194–2204. - PubMed

Publication types

MeSH terms