The landscape of somatic copy-number alteration across human cancers
- PMID: 20164920
- PMCID: PMC2826709
- DOI: 10.1038/nature08822
The landscape of somatic copy-number alteration across human cancers
Abstract
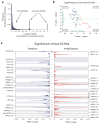
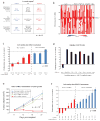
A powerful way to discover key genes with causal roles in oncogenesis is to identify genomic regions that undergo frequent alteration in human cancers. Here we present high-resolution analyses of somatic copy-number alterations (SCNAs) from 3,131 cancer specimens, belonging largely to 26 histological types. We identify 158 regions of focal SCNA that are altered at significant frequency across several cancer types, of which 122 cannot be explained by the presence of a known cancer target gene located within these regions. Several gene families are enriched among these regions of focal SCNA, including the BCL2 family of apoptosis regulators and the NF-kappaBeta pathway. We show that cancer cells containing amplifications surrounding the MCL1 and BCL2L1 anti-apoptotic genes depend on the expression of these genes for survival. Finally, we demonstrate that a large majority of SCNAs identified in individual cancer types are present in several cancer types.
Conflict of interest statement
The authors declare that they have no competing financial interests.
Figures


Similar articles
-
Genomic analysis and selective small molecule inhibition identifies BCL-X(L) as a critical survival factor in a subset of colorectal cancer.Mol Cancer. 2015 Jul 2;14:126. doi: 10.1186/s12943-015-0397-y. Mol Cancer. 2015. PMID: 26134786 Free PMC article.
-
Breast cancer sub-types display heterogeneity in gene amplification and mRNA expression of the anti-apoptotic members of BCL2 family.Gene. 2023 Mar 20;857:147179. doi: 10.1016/j.gene.2023.147179. Epub 2023 Jan 7. Gene. 2023. PMID: 36627096
-
Breast and prostate cancers harbor common somatic copy number alterations that consistently differ by race and are associated with survival.BMC Med Genomics. 2020 Aug 20;13(1):116. doi: 10.1186/s12920-020-00765-2. BMC Med Genomics. 2020. PMID: 32819446 Free PMC article.
-
Down-regulation of intracellular anti-apoptotic proteins, particularly c-FLIP by therapeutic agents; the novel view to overcome resistance to TRAIL.J Cell Physiol. 2018 Oct;233(10):6470-6485. doi: 10.1002/jcp.26585. Epub 2018 May 9. J Cell Physiol. 2018. PMID: 29741767 Review.
-
BCL-2 family isoforms in apoptosis and cancer.Cell Death Dis. 2019 Feb 21;10(3):177. doi: 10.1038/s41419-019-1407-6. Cell Death Dis. 2019. PMID: 30792387 Free PMC article. Review.
Cited by
-
A c-Myc activation sensor-based high-throughput drug screening identifies an antineoplastic effect of nitazoxanide.Mol Cancer Ther. 2013 Sep;12(9):1896-905. doi: 10.1158/1535-7163.MCT-12-1243. Epub 2013 Jul 3. Mol Cancer Ther. 2013. PMID: 23825064 Free PMC article.
-
Silencing of Mcl-1 overcomes resistance of melanoma cells against TRAIL-armed oncolytic adenovirus by enhancement of apoptosis.J Mol Med (Berl). 2021 Sep;99(9):1279-1291. doi: 10.1007/s00109-021-02081-3. Epub 2021 May 24. J Mol Med (Berl). 2021. PMID: 34028599 Free PMC article.
-
Cancer whole-genome sequencing: present and future.Oncogene. 2015 Dec 3;34(49):5943-50. doi: 10.1038/onc.2015.90. Epub 2015 Mar 30. Oncogene. 2015. PMID: 25823020 Review.
-
The Four Homeostasis Knights: In Balance upon Post-Translational Modifications.Int J Mol Sci. 2022 Nov 21;23(22):14480. doi: 10.3390/ijms232214480. Int J Mol Sci. 2022. PMID: 36430960 Free PMC article. Review.
-
N-glycoprotein SRMAtlas: a resource of mass spectrometric assays for N-glycosites enabling consistent and multiplexed protein quantification for clinical applications.Mol Cell Proteomics. 2013 Apr;12(4):1005-16. doi: 10.1074/mcp.O112.026617. Epub 2013 Feb 13. Mol Cell Proteomics. 2013. PMID: 23408683 Free PMC article.
References
-
- Stuart D, Sellers WR. Linking somatic genetic alterations in cancer to therapeutics. Curr Opin Cell Biol. 2009;21:304–310. - PubMed
-
- Mitelman F, Johansson B, Mertens F, editors. Mitelman Database of Chromosome Aberrations in Cancer. 2009. http://cgap.nci.nih.gov/Chromosomes/Mitelman.
Publication types
MeSH terms
Substances
Associated data
- Actions
Grants and funding
- U54 HG003067/HG/NHGRI NIH HHS/United States
- P01CA 098101/CA/NCI NIH HHS/United States
- K08 CA122833-02/CA/NCI NIH HHS/United States
- T32 GM007753/GM/NIGMS NIH HHS/United States
- R01 CA109038/CA/NCI NIH HHS/United States
- P01 CA085859/CA/NCI NIH HHS/United States
- K08 CA122833-03/CA/NCI NIH HHS/United States
- R01CA109467/CA/NCI NIH HHS/United States
- K08 AR055688-04/AR/NIAMS NIH HHS/United States
- K08 AR055688/AR/NIAMS NIH HHS/United States
- U24 CA126546/CA/NCI NIH HHS/United States
- K08CA122833/CA/NCI NIH HHS/United States
- K08 AR055688-03/AR/NIAMS NIH HHS/United States
- HHMI/Howard Hughes Medical Institute/United States
- K08 CA134931/CA/NCI NIH HHS/United States
- R01CA109038/CA/NCI NIH HHS/United States
- K08 CA122833-01A1/CA/NCI NIH HHS/United States
- K08 CA122833/CA/NCI NIH HHS/United States
- P01CA085859/CA/NCI NIH HHS/United States
- P01 CA098101/CA/NCI NIH HHS/United States
- R01 CA109467/CA/NCI NIH HHS/United States
- P50CA90578/CA/NCI NIH HHS/United States
- P50 CA090578/CA/NCI NIH HHS/United States
LinkOut - more resources
Full Text Sources
Other Literature Sources
Molecular Biology Databases
Research Materials

