. 2010 Feb 9;5(2):e9026.
doi: 10.1371/journal.pone.0009026.

DHP-derivative and low oxygen tension effectively induces human adipose stromal cell reprogramming

Affiliations

DHP-derivative and low oxygen tension effectively induces human adipose stromal cell reprogramming

Min Ki Jee et al. PLoS One. .

Abstract

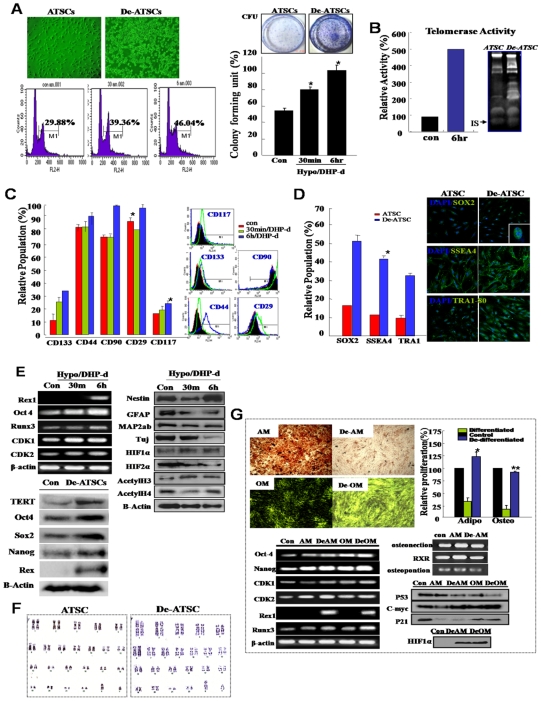
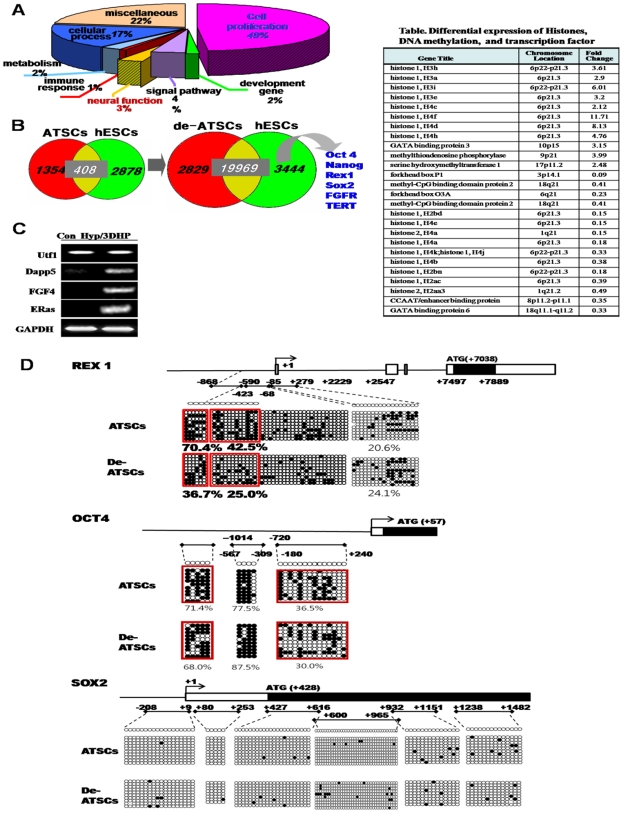
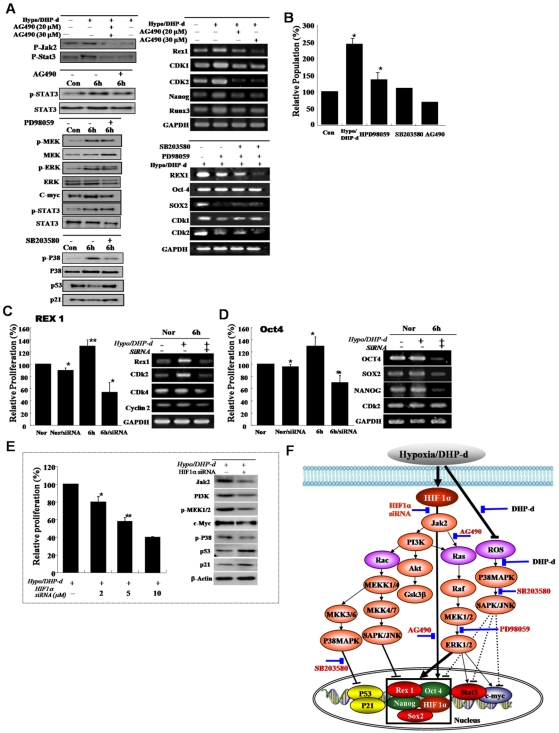
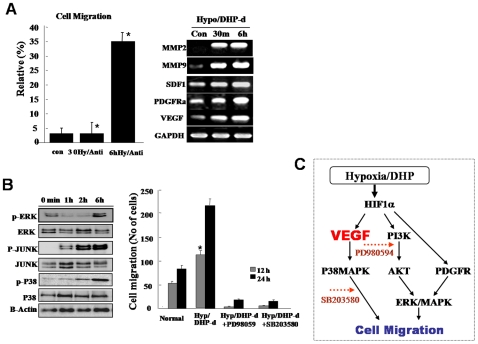
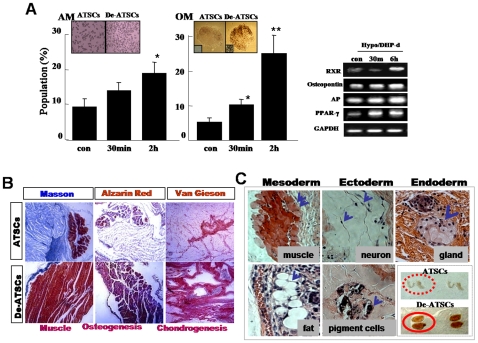
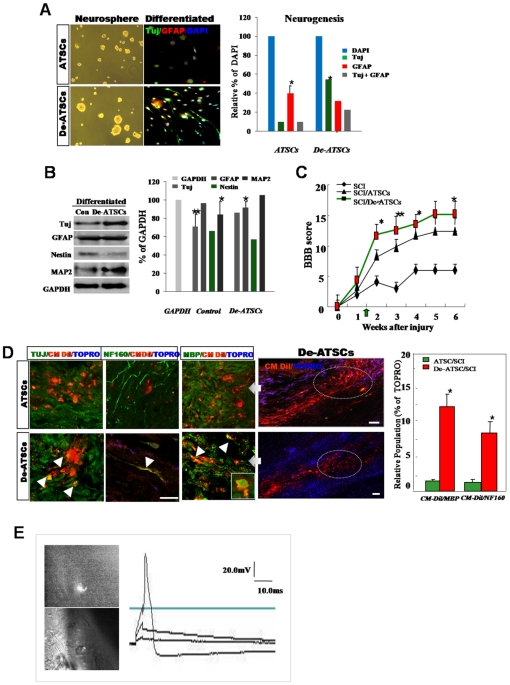
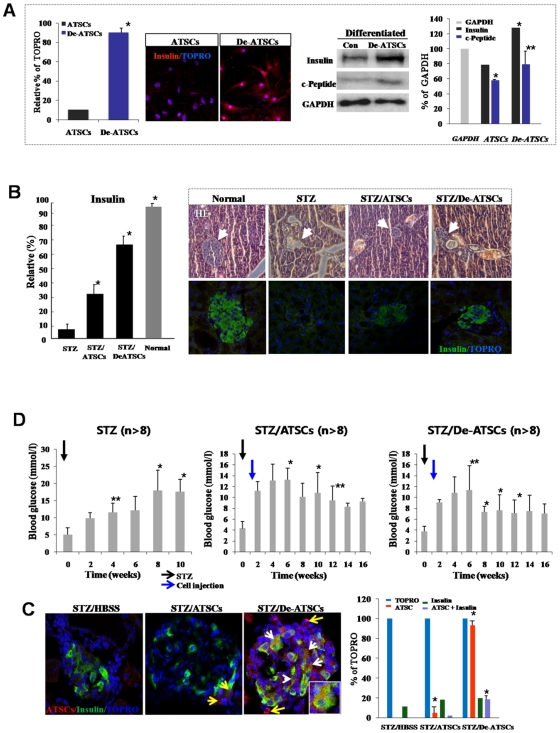
Background and methods: In this study, we utilized a combination of low oxygen tension and a novel anti-oxidant, 4-(3,4-dihydroxy-phenyl)-derivative (DHP-d) to directly induce adipose tissue stromal cells (ATSC) to de-differentiate into more primitive stem cells. De-differentiated ATSCs was overexpress stemness genes, Rex-1, Oct-4, Sox-2, and Nanog. Additionally, demethylation of the regulatory regions of Rex-1, stemnesses, and HIF1alpha and scavenging of reactive oxygen species were finally resulted in an improved stem cell behavior of de-differentiate ATSC (de-ATSC). Proliferation activity of ATSCs after dedifferentiation was induced by REX1, Oct4, and JAK/STAT3 directly or indirectly. De-ATSCs showed increased migration activity that mediated by P38/JUNK and ERK phosphorylation. Moreover, regenerative efficacy of de-ATSC engrafted spinal cord-injured rats and chemical-induced diabetes animals were significantly restored their functions.

Conclusions/significance: Our stem cell remodeling system may provide a good model which would provide insight into the molecular mechanisms underlying ATSC proliferation and transdifferentiation. Also, these multipotent stem cells can be harvested may provide us with a valuable reservoir of primitive and autologous stem cells for use in a broad spectrum of regenerative cell-based disease therapy.


Conflict of interest statement

Competing Interests: The authors have declared that no competing interests exist.

Figures

Figure 1
Figure 1. Combinational hypoxia/DHP-d induced various de-differentiation behaviors in hATSC cells.
(A) The proliferation activity of cultured hypoxia/DHP-d-induced ATSC. Flow cytometric analysis and measuring colony forming units (CFU). For flow cytometric analysis, cells were cultured in 100-mm dishes at densities that ensured exponential growth at the time of harvesting. Harvesting and processing protocols were used to detect DNA via flow cytometry with propidium iodide. The percentages of cells in the G0/G1, S, and G2/M phases of the cell cycle were determined using a DNA histogram fitting program. Clonogenic cell growth experiments were conducted for the detection of colony forming units (CFU). (B) Telomerase assay of de-ATSC compared to control ATSC. Telomerase activity was assessed using a modified TRAP assay using synthetic oligonucleotide, telomerase-specific primer. (C) The expression of surface epitopes changed in de-ATSC. For phenotypic characterization by flow cytometry, de-differentiated ATSC and cultured ATSC adherent cells were incubated with antibodies. The labeled cells were analyzed with a FACScan argon laser cytometer. (D) Analysis of stem cells phenotypic change in cultured de-ATSCs through TRA 1-80, SSEA4, and Sox2 expression analysis. (E) Determination of differential expression of stemness, neural markers, and cell proliferation-associated genes by real time RT-PCR and Western blotting. (F) Detection and confirmation of the chromosomal normality of cultured de-ATSC via karyotyping analysis. (G) De-differentiation of terminal differentiated ATSC-derived bone and evaluation of fat and their pluripotencies through differentiated fat and bone staining and related gene expression analysis. Datas presented are presented as mean ±SD; n>3. * p % 0.05 and ** p % 0.01, Student's t test.
Figure 2
Figure 2. Functional categorization of differentially expressed gene profile and epigenetic reprogramming of stemness genes in de-ATSC.
(A) Functional categorization of genes in de-ATSC. (B) Commonly expressed genes between the de-ATSC and hESC. Also, many kinds of histones and DNA methylation-related transcription factors and enzymes are overexpressed after ATSC de-differentiation (Table). (C) Differential embryonic genes, Utf1, Dapp5, FGF4, and Eras expressions in de-ATSCs. (D) Evaluation of epigenetic modifications through methylation analysis on promoter regions through bisulfite modification and sequencing of genomic DNA. The related method was explained in Materials and Methods S1.
Figure 3
Figure 3. Differential expression of the growth-related signal proteins and Rex-1 involvement in active growth of low oxygen/DHP-d exposed ATSC.
(A, B) The involvement of the JAK/STAT3 and MEK signal protein in active cell growth after de-differentiation of ATSC. For the confirmation of differentially expressed proteins following the de-ATSC, the cells lysates were subjected to SDS-PAGE analysis and transferred to nitrocellulose membranes. Optimally diluted antibodies were incubated with the membranes. The relative band intensities were determined using Quality-one 1-D Analysis software. (C) Prominent inhibition of de-ATSC growth by Rex1 siRNA and (D) Oct4 siRNA. Two complementary hairpin siRNA template oligonucleotides harboring the 21 nt target sequences of the human Rex1 were employed for transient transfection. Three separate Rex1 siRNAs and scrambled siRNAs with the same nucleotide content were assessed. For the detection of the inhibition of de-ATSC growth, we transfected Rex1 siRNA into de-ATSC counted dye-exclusive viable cells for 6 days. (E) Functional involvement of HIFs in de-ATSC proliferation, proliferation controlling signal protein, and stemness genes expression. (F) Schematic flow chart of the low oxygen/DHP-d induced ATSC proliferation signal pathway involving Rex1, Nanog, p53, p21, and c-myc gene expression and activation in the nucleus. Datas presented are presented as mean ±SD; n>5. * p % 0.05, and ** p % 0.01, Student's t test.
Figure 4
Figure 4. De-differentiated ATSCs evidenced active cell migration.
(A) Migration activity of de-ATSC was evaluated as a percentage of the spontaneous migration and related functional factors. The migration activity of the dedifferentiated ATSC in vitro, the cells were transferred to culture dishes containing low serum growth medium. The cultured cells were transferred into transwell membranes (8 µm pore size), coated on both sides with laminin. In the upper chamber, both of cells were preincubated in a CO2 incubator. For analysis, migrating cells on the lower surface were air-dried and counterstained with Harris hematoxylin and the numbers of cells on the lower surfaces were assessed. Ten x20 fields per insert were counted. (B) The migration activity of dedifferentiation of ATSCs was caused by ERK, JUNK, and P38 phosporylations. (C) Proposed molecular mechanism of cell migration after ATSCs reprogramming by DHP-d/Hypoxia. Datas presented are presented as mean ±SD; n>4. * p % 0.05, and ** p % 0.01, Student's t test.
Figure 5
Figure 5. Determination of adipogenic, osteogenic, and muscle differentiation potencies of de-ATSC.
In vitro (A) and in vivo Determination of adipogenic, osteogenic, and muscle differentiation potencies of de-ATSC SCID/NOD mice (B). The transplants were recovered 6 weeks later, stained via Alzarin Red (bone), Masson (muscle, chondrocyte), and Van Gieson (chondrocyte) and collagen IV immunostaining. (C) Teratoma formation from engrafted de-ATSCs in SCID mouse and development of three germ layer-derived tissue or organ such as muscle, neuron, pigment cell, and gland in teratoma after subcutaneously implantation in 8-week-old immunodeficient beige mice. The paraffin-embedded sections were stained via H&E, Alzarin Red (bone), Masson (muscle and chondrocytes), and van Gieson (chondrocytes). Datas presented are presented as mean ±SD; n>4. * p % 0.05, and ** p % 0.01, Student's t test.
Figure 6
Figure 6. The regenerative potency of de-ATSC and their functional efficacy in spinal cord injury rat model.
(A)(B) Evaluation of the neurogenic potency of de-ATSCs in vitro. Neurospheres were cultured and attached on PDL-laminin double-coated well plates. For analysis of the neural markers expression, fixed cells were incubated with primary antibodies against anti-TuJ 1 and anti-GFAP and fluorescence conjugated secondary antibodies sequentially. We then analyzed the cells via fluorescence microscopy. And also we confirmed the neurogenic potency of differentiated de-ATSC by immunoblotting and their quantitative evaluation. (C) In order to determine whether de-ATSCs evidence a regenerative effect in vivo, we compared motor function using a modified BBB hind limb locomotor rating scale 10 days after SCI. (D) And also we evaluated transdifferentiation potency of engrafted cells by immunohistochemical analysis of spinal cord tissue. Detail experimental processes was explained in Materials and Methods. High efficiency of trans-differentiation ability into the neuron and myelin in lesion site of spinal cord. Rounded, dot circle showed specific region for immunohistochemical analysis of regenerative activity of de-ATSCs in SCI tissue. Raw data from each experiment were analyzed via analysis of variance with Fisher's or t-tests. Scale bars represent 40 μm. (E) Functionally active, transdifferentiated neurons from engrafted cells was evaluated by recording of their evoked action potential before, immediately after and 30 days after the sciatic axotomy. Bipolar hooked platinum recording and stimulating electrodes were used to induce and record electrical activity. The evoked action potential in responding to the stimuli (one ms, 20.0 mV) in the ipsilateral sciatic nerve was recorded. Datas presented are presented as mean ±SD; n>5. * p % 0.05, and ** p % 0.01, Student's t test.
Figure 7
Figure 7. Reversion of the hyperglycemic condition and regeneration of beta-pancreatic islets in de-ATSCs-treated type 1 diabetic mice.
(A) Beta cell differentiation potency of de-ATSCs cells. For beta-like cell differentiation, cells were cultured in “N2 media+NA” containing DMEM/F12. After the induction of differentiation, we conducted immnocytochemistry and western blotting using and insulin and c-peptide antibodies. (B) Quantitative measurement of secreting insulin from de-ATSCs engrafted type1 diabetic animals (left). For analysis of pancreatic islets tissue-derived insulin secreting functions after anti-insulin/green fluorescence marked ATSCs control and de-ATSC cells treatment in diabetes animals (right). Pancreatic islets dissected on day 21 from control and STZ-treated mice were stained with hematoxylin and eosin or (C) immunostained for mouse insulin. Scale bars  = 20 μm. White arrows revealed that transdifferentiated and insulin secreting engrafted de-ATSCs. (D) Measurement of blood glucose concentration before and after each cell (2×10⁵ cells) engraftment. Pancreatic damage was induced with intraperitoneal injection of 50 mg/kg of body weight STZ daily for five consecutive days. Datas presented are presented as mean ±SD; n>8. Black and blue arrows appear the date of STZ and cells injection each other. Detail experimental processes was explained in Materials and Methods. Data are represented as mean ±SD; n>8. * p % 0.05, and ** p % 0.01, Student's t test.

Similar articles

Cited by

References

    1. Goodell MA. Stem-cell “plasticity”: befuddled by the muddle. Curr opin hematol. 2003;10:208–13. - PubMed
    1. Wagers AJ, Weissman IL. Plasticity of adult stem cells. Cell. 2004;116:639–48. - PubMed
    1. Grafi G. How cells dedifferentiate: a lesson from plants. Dev Biol. 2004;268:1–6. - PubMed
    1. Takebe I, Labib G, Melchers G. Regeneration of whole plants from isolated mesophyll protoplasts of tobacco. Naturwissenschaften. 1971;58:318–320.
    1. Valente O, Tao W, Verbelen JP. Auxins and cytokinins control DNA endoreduplication and deduplication in single cells of tobacco. Plant Sci. 1998;134:207–215.

Publication types

MeSH terms