

Structure of the Saccharomyces cerevisiae Cet1-Ceg1 mRNA capping apparatus
- PMID: 20159466
- PMCID: PMC2877398
- DOI: 10.1016/j.str.2009.12.009
Structure of the Saccharomyces cerevisiae Cet1-Ceg1 mRNA capping apparatus
Abstract
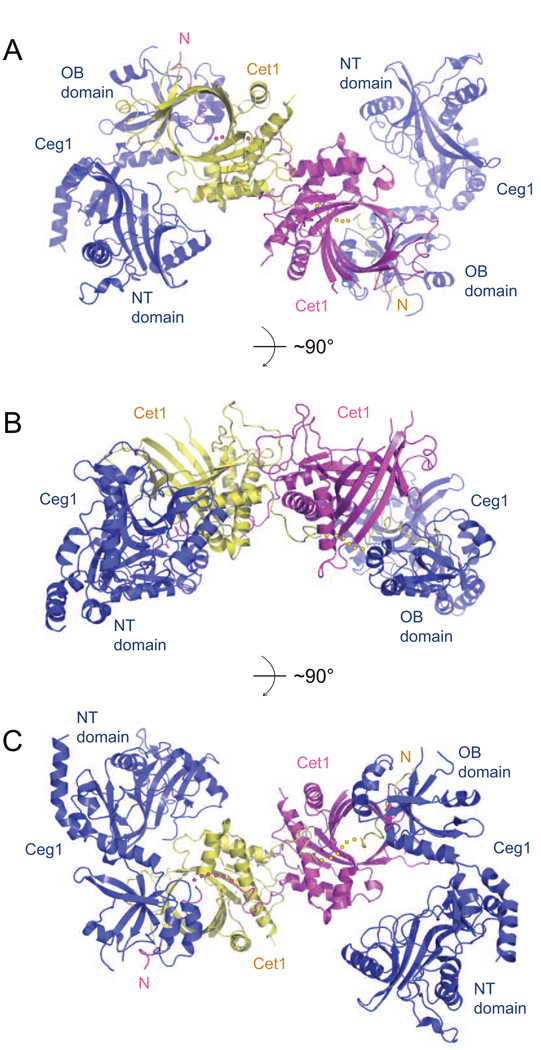
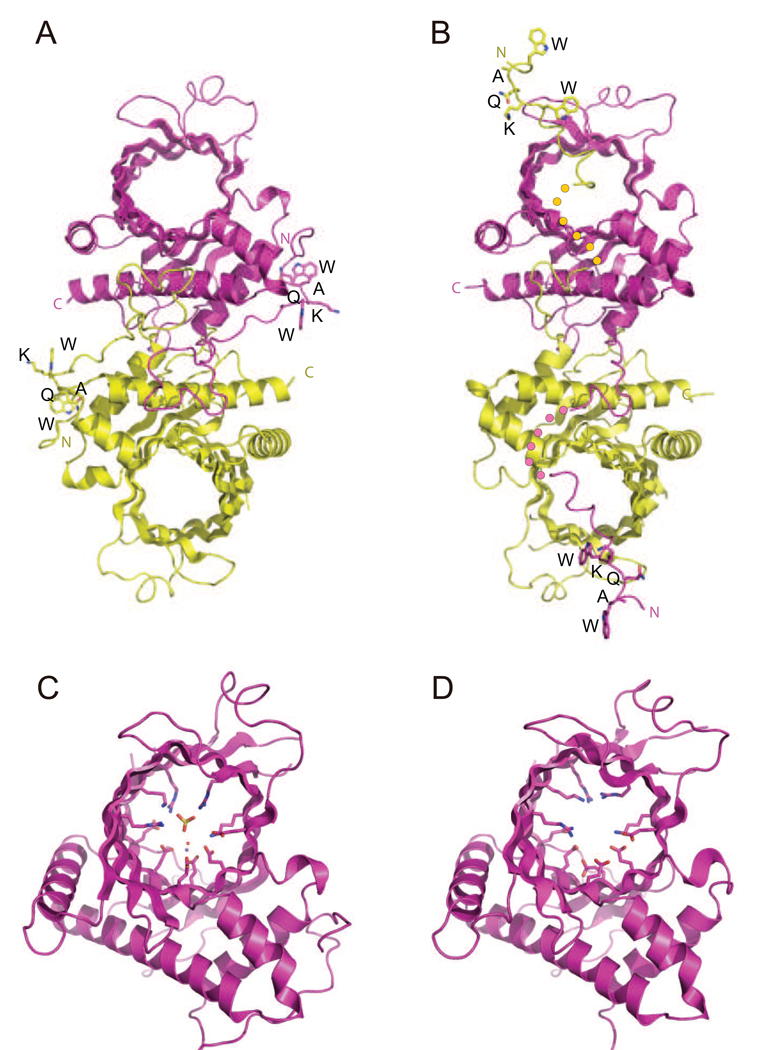
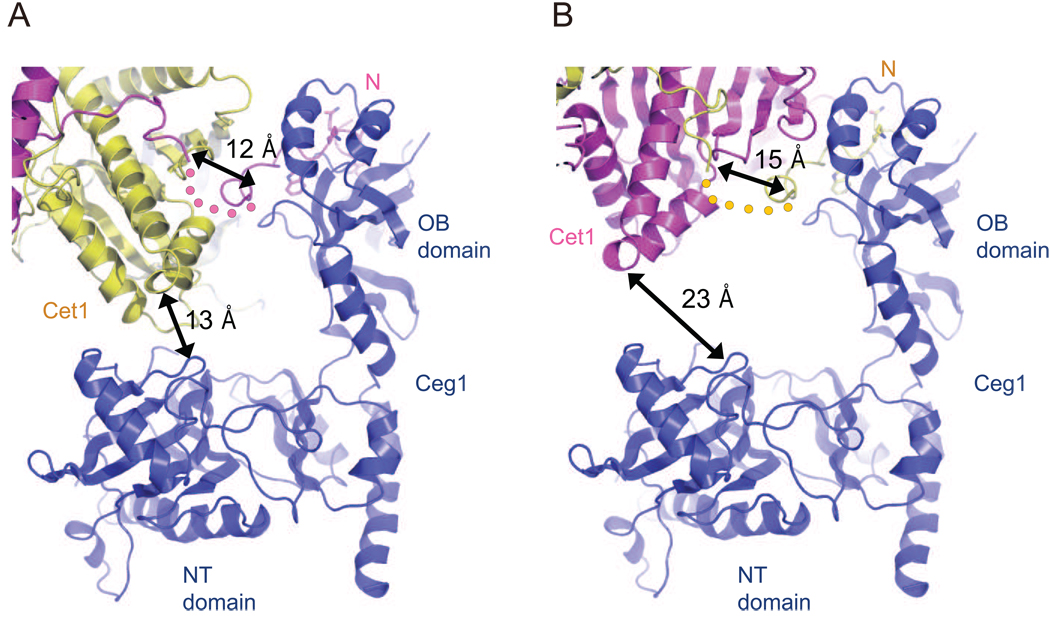
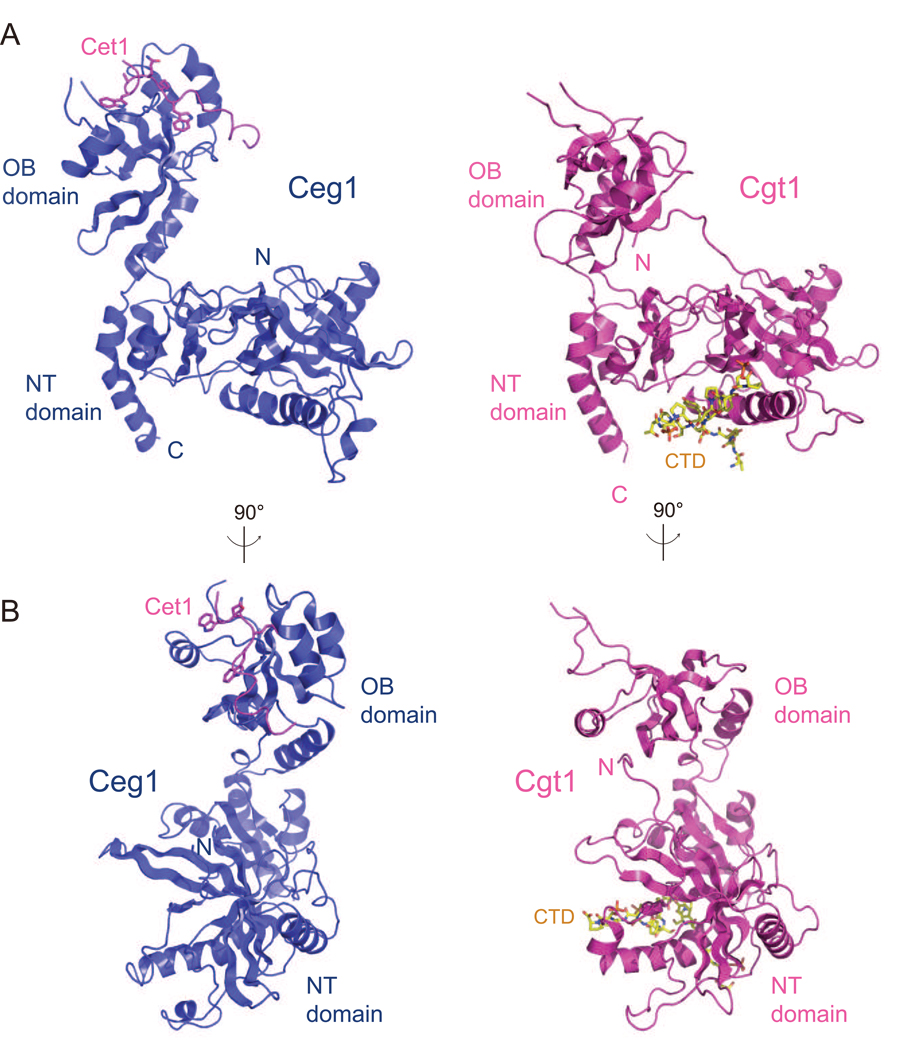
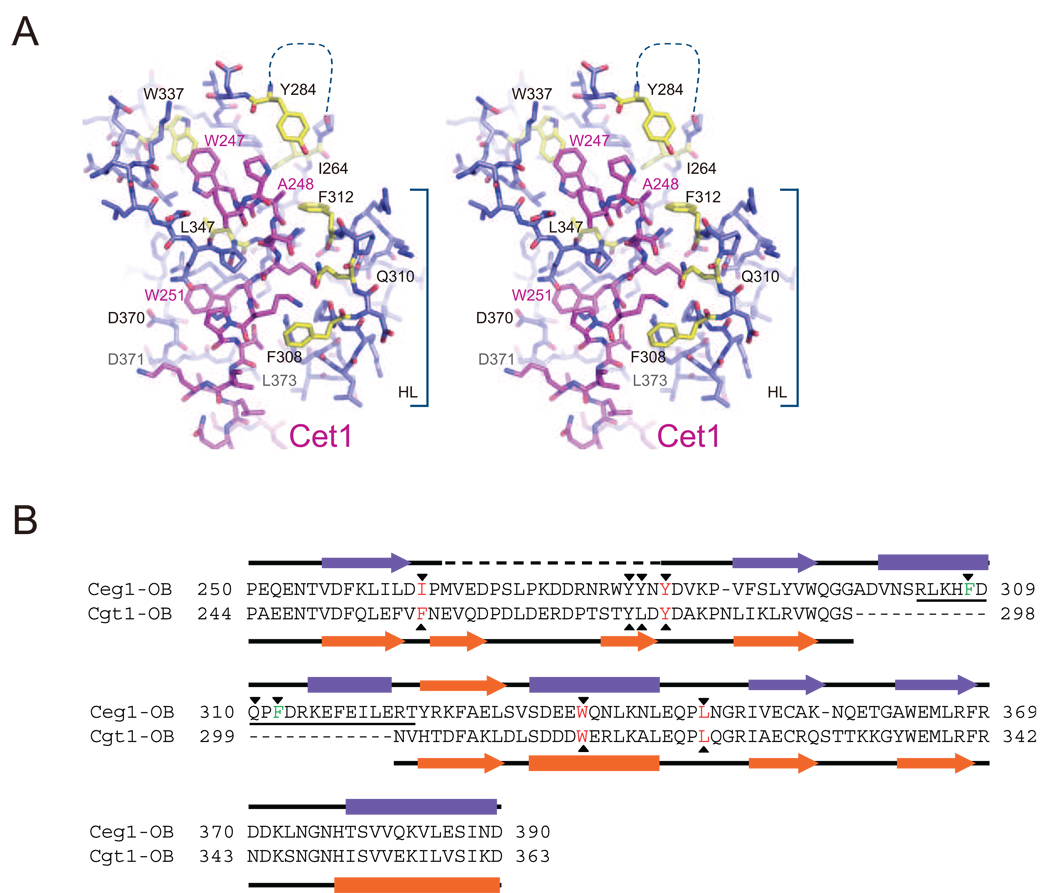
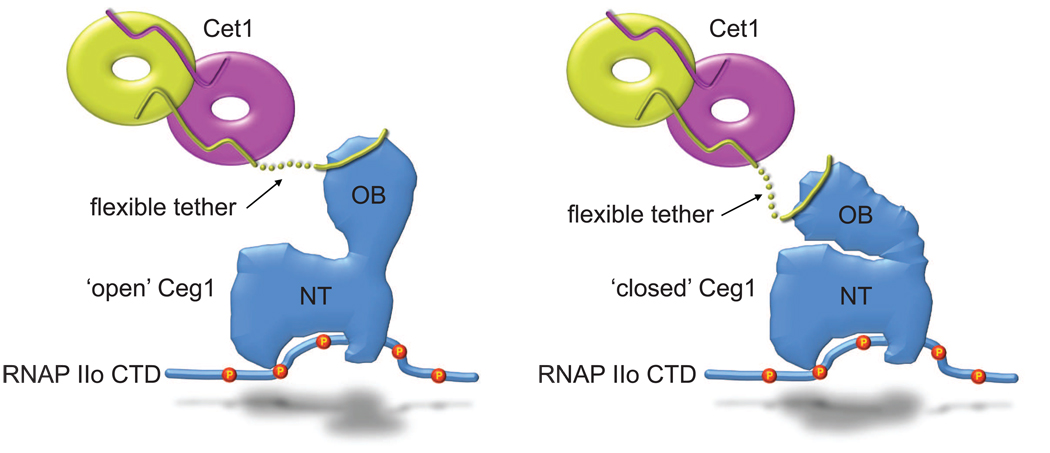
The 5' guanine-N7 cap is the first cotranscriptional modification of messenger RNA. In Saccharomyces cerevisiae, the first two steps in capping are catalyzed by the RNA triphosphatase Cet1 and RNA guanylyltransferase Ceg1, which form a complex that is directly recruited to phosphorylated RNA polymerase II (RNAP IIo), primarily via contacts between RNAP IIo and Ceg1. A 3.0 A crystal structure of Cet1-Ceg1 revealed a 176 kDa heterotetrameric complex composed of one Cet1 homodimer that associates with two Ceg1 molecules via interactions between the Ceg1 oligonucleotide binding domain and an extended Cet1 WAQKW amino acid motif. The WAQKW motif is followed by a flexible linker that would allow Ceg1 to achieve conformational changes required for capping while maintaining interactions with both Cet1 and RNAP IIo. The impact of mutations as assessed through genetic analysis in S. cerevisiae is consonant with contacts observed in the Cet1-Ceg1 structure.
Copyright 2010 Elsevier Ltd. All rights reserved.
Figures

Similar articles
-
Enzymology of RNA cap synthesis.Wiley Interdiscip Rev RNA. 2010 Jul-Aug;1(1):152-72. doi: 10.1002/wrna.19. Epub 2010 May 25. Wiley Interdiscip Rev RNA. 2010. PMID: 21956912 Free PMC article. Review.
-
Genetic, physical, and functional interactions between the triphosphatase and guanylyltransferase components of the yeast mRNA capping apparatus.Mol Cell Biol. 1998 Sep;18(9):5189-98. doi: 10.1128/MCB.18.9.5189. Mol Cell Biol. 1998. PMID: 9710603 Free PMC article.
-
The essential interaction between yeast mRNA capping enzyme subunits is not required for triphosphatase function in vivo.Mol Cell Biol. 2000 Dec;20(24):9307-16. doi: 10.1128/MCB.20.24.9307-9316.2000. Mol Cell Biol. 2000. PMID: 11094081 Free PMC article.
-
An essential function of Saccharomyces cerevisiae RNA triphosphatase Cet1 is to stabilize RNA guanylyltransferase Ceg1 against thermal inactivation.J Biol Chem. 2001 Sep 28;276(39):36116-24. doi: 10.1074/jbc.M105856200. Epub 2001 Jul 19. J Biol Chem. 2001. PMID: 11463793
-
The mRNA capping apparatus as drug target and guide to eukaryotic phylogeny.Cold Spring Harb Symp Quant Biol. 2001;66:301-12. doi: 10.1101/sqb.2001.66.301. Cold Spring Harb Symp Quant Biol. 2001. PMID: 12762032 Review. No abstract available.
Cited by
-
The mRNA capping enzyme of Saccharomyces cerevisiae has dual specificity to interact with CTD of RNA Polymerase II.Sci Rep. 2016 Aug 9;6:31294. doi: 10.1038/srep31294. Sci Rep. 2016. PMID: 27503426 Free PMC article.
-
A dual interface determines the recognition of RNA polymerase II by RNA capping enzyme.J Biol Chem. 2010 Oct 29;285(44):34027-38. doi: 10.1074/jbc.M110.145110. Epub 2010 Aug 18. J Biol Chem. 2010. PMID: 20720002 Free PMC article.
-
Fission yeast RNA triphosphatase reads an Spt5 CTD code.RNA. 2015 Jan;21(1):113-23. doi: 10.1261/rna.048181.114. Epub 2014 Nov 20. RNA. 2015. PMID: 25414009 Free PMC article.
-
Structural insights to how mammalian capping enzyme reads the CTD code.Mol Cell. 2011 Jul 22;43(2):299-310. doi: 10.1016/j.molcel.2011.06.001. Epub 2011 Jun 16. Mol Cell. 2011. PMID: 21683636 Free PMC article.
-
Enzymology of RNA cap synthesis.Wiley Interdiscip Rev RNA. 2010 Jul-Aug;1(1):152-72. doi: 10.1002/wrna.19. Epub 2010 May 25. Wiley Interdiscip Rev RNA. 2010. PMID: 21956912 Free PMC article. Review.
References
-
- Benarroch D, Smith P, Shuman S. Characterization of a trifunctional mimivirus mRNA capping enzyme and crystal structure of the triphosphatase domain. Structure. 2008;16:501–512. - PubMed
-
- Brunger AT, Adams PD, Clore GM, DeLano WL, Gros P, Grosse-Kunstleve RW, Jiang JS, Kuszewski J, Nilges M, Pannu NS, Read RJ, Rice LM, Simonson T, Warren GL. Crystallography & NMR system: A new software suite for macromolecular structure determination. Acta. Crystallogr. D Biol. Crystallogr. 1998;54:905–921. - PubMed
-
- Chiu YL, Ho CK, Saha N, Schwer B, Shuman S, Rana TM. Tat stimulates cotranscriptional capping of HIV mRNA. Mol. Cell. 2002;10:585–597. - PubMed
Publication types
MeSH terms
Substances
Associated data
- Actions
Grants and funding
LinkOut - more resources
Full Text Sources
Other Literature Sources
Molecular Biology Databases
Miscellaneous
