Loss of synaptotagmin IV results in a reduction in synaptic vesicles and a distortion of the Golgi structure in cultured hippocampal neurons
- PMID: 20138128
- PMCID: PMC3102522
- DOI: 10.1016/j.neuroscience.2010.01.056
Loss of synaptotagmin IV results in a reduction in synaptic vesicles and a distortion of the Golgi structure in cultured hippocampal neurons
Abstract
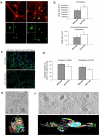
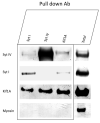
Fusion of synaptic vesicles with the plasma membrane is mediated by the SNARE (soluble NSF attachment receptor) proteins and is regulated by synaptotagmin (syt). There are at least 17 syt isoforms that have the potential to act as modulators of membrane fusion events. Synaptotagmin IV (syt IV) is particularly interesting; it is an immediate early gene that is regulated by seizures and certain classes of drugs, and, in humans, syt IV maps to a region of chromosome 18 associated with schizophrenia and bipolar disease. Syt IV has recently been found to localize to dense core vesicles in hippocampal neurons, where it regulates neurotrophin release. Here we have examined the ultrastructure of cultured hippocampal neurons from wild-type and syt IV -/- mice using electron tomography. Perhaps surprisingly, we observed a potential synaptic vesicle transport defect in syt IV -/- neurons, with the accumulation of large numbers of small clear vesicles (putative axonal transport vesicles) near the trans-Golgi network. We also found an interaction between syt IV and KIF1A, a kinesin known to be involved in vesicle trafficking to the synapse. Finally, we found that syt IV -/- synapses exhibited reduced numbers of synaptic vesicles and a twofold reduction in the proportion of docked vesicles compared to wild-type. The proportion of docked vesicles in syt IV -/- boutons was further reduced, 5-fold, following depolarization.
Copyright 2010 IBRO. Published by Elsevier Ltd. All rights reserved.
Figures


Similar articles
-
Function of Drosophila Synaptotagmins in membrane trafficking at synapses.Cell Mol Life Sci. 2021 May;78(9):4335-4364. doi: 10.1007/s00018-021-03788-9. Epub 2021 Feb 22. Cell Mol Life Sci. 2021. PMID: 33619613 Free PMC article. Review.
-
Synaptotagmin-IV modulates synaptic function and long-term potentiation by regulating BDNF release.Nat Neurosci. 2009 Jun;12(6):767-76. doi: 10.1038/nn.2315. Epub 2009 May 17. Nat Neurosci. 2009. PMID: 19448629 Free PMC article.
-
Autapses and networks of hippocampal neurons exhibit distinct synaptic transmission phenotypes in the absence of synaptotagmin I.J Neurosci. 2009 Jun 10;29(23):7395-403. doi: 10.1523/JNEUROSCI.1341-09.2009. J Neurosci. 2009. PMID: 19515907 Free PMC article.
-
Non-polarized distribution of synaptotagmin IV in neurons: evidence that synaptotagmin IV is not a synaptic vesicle protein.Neurosci Res. 2002 Aug;43(4):401-6. doi: 10.1016/s0168-0102(02)00066-4. Neurosci Res. 2002. PMID: 12135783
-
Physical link and functional coupling of presynaptic calcium channels and the synaptic vesicle docking/fusion machinery.J Bioenerg Biomembr. 1998 Aug;30(4):335-45. doi: 10.1023/a:1021985521748. J Bioenerg Biomembr. 1998. PMID: 9758330 Review.
Cited by
-
Transport of a kinesin-cargo pair along microtubules into dendritic spines undergoing synaptic plasticity.Nat Commun. 2016 Sep 23;7:12741. doi: 10.1038/ncomms12741. Nat Commun. 2016. PMID: 27658622 Free PMC article.
-
Structure of the Golgi apparatus is not influenced by a GAG deletion mutation in the dystonia-associated gene Tor1a.PLoS One. 2018 Nov 7;13(11):e0206123. doi: 10.1371/journal.pone.0206123. eCollection 2018. PLoS One. 2018. PMID: 30403723 Free PMC article.
-
Synaptotagmin 17 controls neurite outgrowth and synaptic physiology via distinct cellular pathways.Nat Commun. 2019 Aug 6;10(1):3532. doi: 10.1038/s41467-019-11459-4. Nat Commun. 2019. PMID: 31387992 Free PMC article.
-
Somatodendritic dopamine release requires synaptotagmin 4 and 7 and the participation of voltage-gated calcium channels.J Biol Chem. 2011 Jul 8;286(27):23928-37. doi: 10.1074/jbc.M111.218032. Epub 2011 May 16. J Biol Chem. 2011. PMID: 21576241 Free PMC article.
-
Function of Drosophila Synaptotagmins in membrane trafficking at synapses.Cell Mol Life Sci. 2021 May;78(9):4335-4364. doi: 10.1007/s00018-021-03788-9. Epub 2021 Feb 22. Cell Mol Life Sci. 2021. PMID: 33619613 Free PMC article. Review.
References
-
- Bai J, Wang CT, Richards DA, Jackson MB, Chapman ER. Fusion pore dynamics are regulated by synaptotagmin*t-SNARE interactions. Neuron. 2004;41:929–942. - PubMed
-
- Banker GA, Cowan WM. Rat hippocampal neurons in dispersed cell culture. Brain Res. 1977;126:397–342. - PubMed
-
- Berton F, Cornet V, Iborra C, Garrido J, Dargent B, Fukuda M, Seagar M, Marqueze B. Synaptotagmin I and IV define distinct populations of neuronal transport vesicles. Eur J Neurosci. 2000;12:1294–1302. - PubMed
MeSH terms
Substances
Grants and funding
LinkOut - more resources
Full Text Sources
Molecular Biology Databases

