Subcellular dynamics of T cell immunological synapses and kinapses in lymph nodes
- PMID: 20133676
- PMCID: PMC2840513
- DOI: 10.1073/pnas.0905901107
Subcellular dynamics of T cell immunological synapses and kinapses in lymph nodes
Abstract
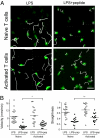
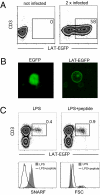
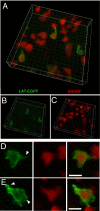
In vitro studies have revealed that T cell activation occurs during the formation of either dynamic or stable interactions with antigen-presenting cells (APC), and the respective cell junctions have been referred to as immunological kinapses and synapses. However, the relevance and molecular dynamics of kinapses and synapses remain to be established in vivo. Using two-photon imaging, we tracked the distribution of LAT-EGFP molecules during antigen recognition by activated CD4(+) T cells in lymph nodes. At steady state, LAT-EGFP molecules were preferentially found at the uropod of rapidly migrating T cells. In contrast to naïve T cells that fully stopped upon systemic antigen delivery, recently activated T cells decelerated and formed kinapses, characterized by continuous extension of membrane protrusions and by the absence of persistent LAT-EGFP clustering. On the other hand, activated CD4(+) T cells formed stable immunological synapses with antigen-loaded B cells and displayed sustained accumulation of LAT-EGFP fluorescence at the contact zone. Our results show that the state of T cell activation and the type of APC largely influence T cell-APC contact dynamics in lymph nodes. Furthermore, we provide a dynamic look at immunological kinapses and synapses in lymph nodes and suggest the existence of distinct patterns of LAT redistribution during antigen recognition.
Conflict of interest statement
The authors declare no conflict of interest.
Figures


Similar articles
-
In Vivo Imaging of T Cell Immunological Synapses and Kinapses in Lymph Nodes.Methods Mol Biol. 2017;1584:559-568. doi: 10.1007/978-1-4939-6881-7_35. Methods Mol Biol. 2017. PMID: 28255726
-
Age-dependent alterations in the assembly of signal transduction complexes at the site of T cell/APC interaction.J Immunol. 2000 Aug 1;165(3):1243-51. doi: 10.4049/jimmunol.165.3.1243. J Immunol. 2000. PMID: 10903722
-
IFT20 controls LAT recruitment to the immune synapse and T-cell activation in vivo.Proc Natl Acad Sci U S A. 2016 Jan 12;113(2):386-91. doi: 10.1073/pnas.1513601113. Epub 2015 Dec 29. Proc Natl Acad Sci U S A. 2016. PMID: 26715756 Free PMC article.
-
Functional anatomy of T cell activation and synapse formation.Annu Rev Immunol. 2010;28:79-105. doi: 10.1146/annurev-immunol-030409-101308. Annu Rev Immunol. 2010. PMID: 19968559 Free PMC article. Review.
-
Visualization of cell-cell interaction contacts-synapses and kinapses.Adv Exp Med Biol. 2008;640:164-82. doi: 10.1007/978-0-387-09789-3_13. Adv Exp Med Biol. 2008. PMID: 19065791 Review.
Cited by
-
Functional single-cell analysis of T-cell activation by supported lipid bilayer-tethered ligands on arrays of nanowells.Lab Chip. 2013 Jan 7;13(1):90-9. doi: 10.1039/c2lc40869d. Epub 2012 Oct 15. Lab Chip. 2013. PMID: 23070211 Free PMC article.
-
Protocol to quantify the activation dynamics of tumor-associated T cells in mice by functional intravital microscopy.STAR Protoc. 2024 Dec 20;5(4):103310. doi: 10.1016/j.xpro.2024.103310. Epub 2024 Sep 21. STAR Protoc. 2024. PMID: 39306849 Free PMC article.
-
The Role of Lymphatic Niches in T Cell Differentiation.Mol Cells. 2016 Jul;39(7):515-23. doi: 10.14348/molcells.2016.0089. Epub 2016 Jun 16. Mol Cells. 2016. PMID: 27306645 Free PMC article. Review.
-
Adhesive Interactions Delineate the Topography of the Immune Synapse.Front Cell Dev Biol. 2018 Oct 30;6:149. doi: 10.3389/fcell.2018.00149. eCollection 2018. Front Cell Dev Biol. 2018. PMID: 30425987 Free PMC article. Review.
-
HIV-1 Virological Synapse: Live Imaging of Transmission.Viruses. 2010 Aug;2(8):1666-1680. doi: 10.3390/v2081666. Epub 2010 Aug 12. Viruses. 2010. PMID: 21994700 Free PMC article.
References
-
- Dustin ML. Hunter to gatherer and back: Immunological synapses and kinapses as variations on the theme of amoeboid locomotion. Annu Rev Cell Dev Biol. 2008;24:577–596. - PubMed
-
- Billadeau DD, Nolz JC, Gomez TS. Regulation of T-cell activation by the cytoskeleton. Nat Rev Immunol. 2007;7:131–143. - PubMed
-
- Das V, et al. Membrane-cytoskeleton interactions during the formation of the immunological synapse and subsequent T-cell activation. Immunol Rev. 2002;189:123–135. - PubMed
-
- Kupfer A, Dennert G. Reorientation of the microtubule-organizing center and the Golgi apparatus in cloned cytotoxic lymphocytes triggered by binding to lysable target cells. J Immunol. 1984;133:2762–2766. - PubMed
Publication types
MeSH terms
Substances
LinkOut - more resources
Full Text Sources
Other Literature Sources
Molecular Biology Databases
Research Materials

