

Farnesol induces hydrogen peroxide resistance in Candida albicans yeast by inhibiting the Ras-cyclic AMP signaling pathway
- PMID: 20118211
- PMCID: PMC2863405
- DOI: 10.1128/EC.00321-09
Farnesol induces hydrogen peroxide resistance in Candida albicans yeast by inhibiting the Ras-cyclic AMP signaling pathway
Abstract
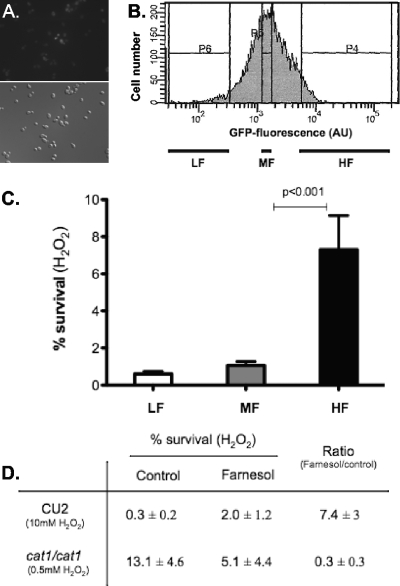
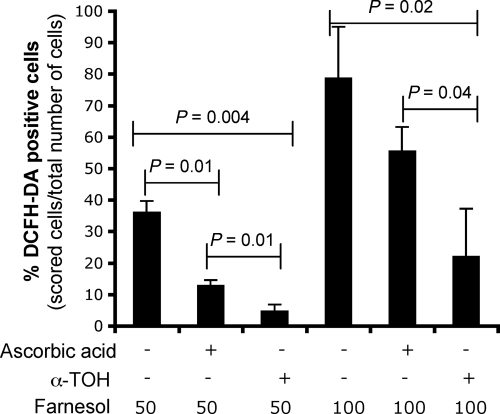
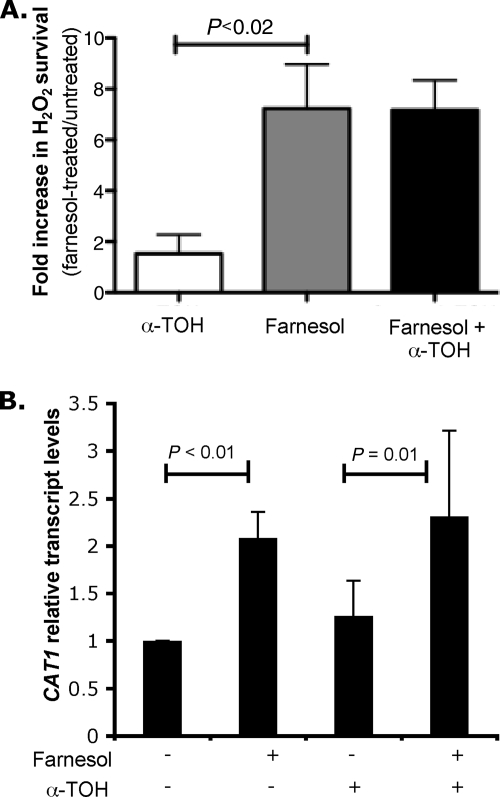
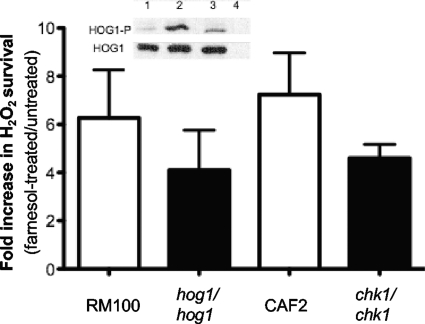
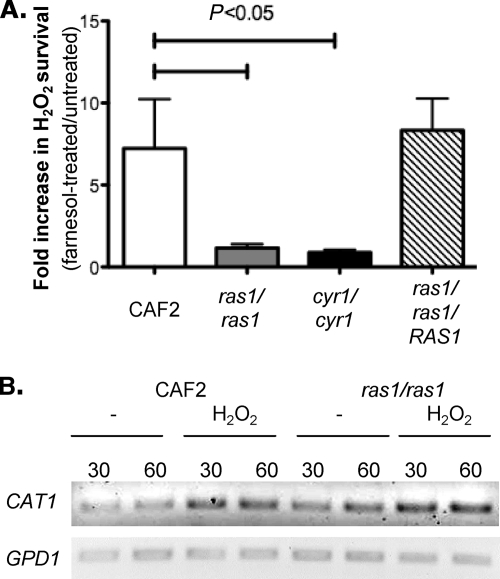
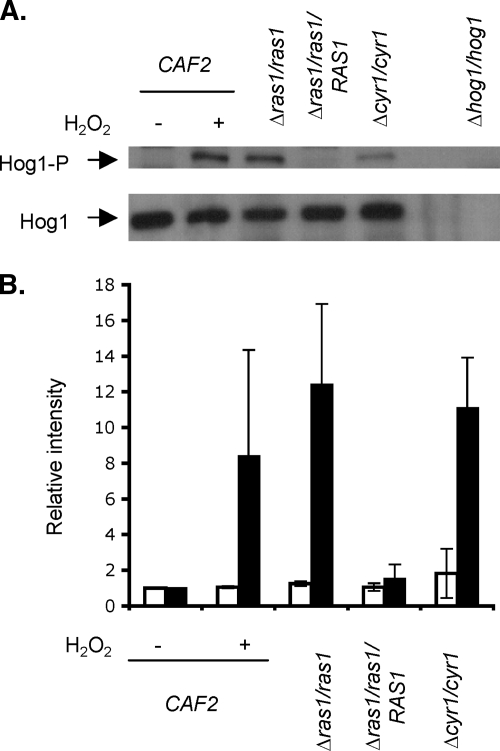
Farnesol, a Candida albicans cell-cell signaling molecule that participates in the control of morphology, has an additional role in protection of the fungus against oxidative stress. In this report, we show that although farnesol induces the accumulation of intracellular reactive oxygen species (ROS), ROS generation is not necessary for the induction of catalase (Cat1)-mediated oxidative-stress resistance. Two antioxidants, alpha-tocopherol and, to a lesser extent, ascorbic acid effectively reduced intracellular ROS generation by farnesol but did not alter farnesol-induced oxidative-stress resistance. Farnesol inhibits the Ras1-adenylate cyclase (Cyr1) signaling pathway to achieve its effects on morphology under hypha-inducing conditions, and we demonstrate that farnesol induces oxidative-stress resistance by a similar mechanism. Strains lacking either Ras1 or Cyr1 no longer exhibited increased protection against hydrogen peroxide upon preincubation with farnesol. While we also observed the previously reported increase in the phosphorylation level of Hog1, a known regulator of oxidative-stress resistance, in the presence of farnesol, the hog1/hog1 mutant did not differ from wild-type strains in terms of farnesol-induced oxidative-stress resistance. Analysis of Hog1 levels and its phosphorylation states in different mutant backgrounds indicated that mutation of the components of the Ras1-adenylate cyclase pathway was sufficient to cause an increase of Hog1 phosphorylation even in the absence of farnesol or other exogenous sources of oxidative stress. This finding indicates the presence of unknown links between these signaling pathways. Our results suggest that farnesol effects on the Ras-adenylate cyclase cascade are responsible for many of the observed activities of this fungal signaling molecule.
Figures

Similar articles
-
Farnesol and cyclic AMP signaling effects on the hypha-to-yeast transition in Candida albicans.Eukaryot Cell. 2012 Oct;11(10):1219-25. doi: 10.1128/EC.00144-12. Epub 2012 Aug 10. Eukaryot Cell. 2012. PMID: 22886999 Free PMC article.
-
Candida albicans-conditioned medium protects yeast cells from oxidative stress: a possible link between quorum sensing and oxidative stress resistance.Eukaryot Cell. 2005 Oct;4(10):1654-61. doi: 10.1128/EC.4.10.1654-1661.2005. Eukaryot Cell. 2005. PMID: 16215173 Free PMC article.
-
Roles of Ras1 membrane localization during Candida albicans hyphal growth and farnesol response.Eukaryot Cell. 2011 Nov;10(11):1473-84. doi: 10.1128/EC.05153-11. Epub 2011 Sep 9. Eukaryot Cell. 2011. PMID: 21908593 Free PMC article.
-
Properties and role of the quorum sensing molecule farnesol in relation to the yeast Candida albicans.Pharmazie. 2017 Jun 1;72(6):307-312. doi: 10.1691/ph.2017.6174. Pharmazie. 2017. PMID: 29442016 Review.
-
Multiple roles and diverse regulation of the Ras/cAMP/protein kinase A pathway in Candida albicans.Mol Microbiol. 2019 Jan;111(1):6-16. doi: 10.1111/mmi.14148. Epub 2018 Nov 4. Mol Microbiol. 2019. PMID: 30299574 Review.
Cited by
-
Spatial reorganization of Saccharomyces cerevisiae enolase to alter carbon metabolism under hypoxia.Eukaryot Cell. 2013 Aug;12(8):1106-19. doi: 10.1128/EC.00093-13. Epub 2013 Jun 7. Eukaryot Cell. 2013. PMID: 23748432 Free PMC article.
-
Abrogation of pathogenic attributes in drug resistant Candida auris strains by farnesol.PLoS One. 2020 May 11;15(5):e0233102. doi: 10.1371/journal.pone.0233102. eCollection 2020. PLoS One. 2020. PMID: 32392266 Free PMC article.
-
The quorum-sensing molecules farnesol/homoserine lactone and dodecanol operate via distinct modes of action in Candida albicans.Eukaryot Cell. 2011 Aug;10(8):1034-42. doi: 10.1128/EC.05060-11. Epub 2011 Jun 10. Eukaryot Cell. 2011. PMID: 21666074 Free PMC article.
-
The impact of farnesol in combination with fluconazole on Candida albicans biofilm: regulation of ERG20, ERG9, and ERG11 genes.Folia Microbiol (Praha). 2018 May;63(3):363-371. doi: 10.1007/s12223-017-0574-z. Epub 2017 Dec 12. Folia Microbiol (Praha). 2018. PMID: 29234974
-
Effect of farnesol on growth, ergosterol biosynthesis, and cell permeability in Coccidioides posadasii.Antimicrob Agents Chemother. 2013 May;57(5):2167-70. doi: 10.1128/AAC.02457-12. Epub 2013 Mar 4. Antimicrob Agents Chemother. 2013. PMID: 23459491 Free PMC article.
References
-
- Boguslawski G. 1992. PBS2, a yeast gene encoding a putative protein kinase, interacts with the RAS2 pathway and affects osmotic sensitivity of Saccharomyces cerevisiae. J. Gen. Microbiol. 138:2425–2432 - PubMed
-
- Burke Y. D., Ayoubi A. S., Werner S. R., McFarland B. C., Heilman D. K., Ruggeri B. A., Crowell P. L. 2002. Effects of the isoprenoids perillyl alcohol and farnesol on apoptosis biomarkers in pancreatic cancer chemoprevention. Anticancer Res. 22:3127–3134 - PubMed
-
- Bustamante C. I. 2005. Treatment of Candida infection: a view from the trenches! Curr. Opin. Infect. Dis. 18:490–495 - PubMed
Publication types
MeSH terms
Substances
Grants and funding
LinkOut - more resources
Full Text Sources
Miscellaneous
