Brain tissue sodium concentration in multiple sclerosis: a sodium imaging study at 3 tesla
- PMID: 20110245
- PMCID: PMC2842511
- DOI: 10.1093/brain/awp334
Brain tissue sodium concentration in multiple sclerosis: a sodium imaging study at 3 tesla
Abstract
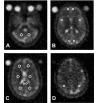
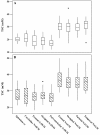
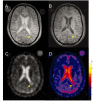
Neuro-axonal degeneration occurs progressively from the onset of multiple sclerosis and is thought to be a significant cause of increasing clinical disability. Several histopathological studies of multiple sclerosis and experimental autoimmune encephalomyelitis have shown that the accumulation of sodium in axons can promote reverse action of the sodium/calcium exchanger that, in turn, leads to a lethal overload in intra-axonal calcium. We hypothesized that sodium magnetic resonance imaging would provide an indicator of cellular and metabolic integrity and ion homeostasis in patients with multiple sclerosis. Using a three-dimensional radial gradient-echo sequence with short echo time, we performed sodium magnetic resonance imaging at 3 T in 17 patients with relapsing-remitting multiple sclerosis and in 13 normal subjects. The absolute total tissue sodium concentration was measured in lesions and in several areas of normal-appearing white and grey matter in patients, and corresponding areas of white and grey matter in controls. A mixed model analysis of covariance was performed to compare regional tissue sodium concentration levels in patients and controls. Spearman correlations were used to determine the association of regional tissue sodium concentration levels in T(2)- and T(1)-weighted lesions with measures of normalized whole brain and grey and white matter volumes, and with expanded disability status scale scores. In patients, tissue sodium concentration levels were found to be elevated in acute and chronic lesions compared to areas of normal-appearing white matter (P < 0.0001). The tissue sodium concentration levels in areas of normal-appearing white matter were significantly higher than those in corresponding white matter regions in healthy controls (P < 0.0001). The tissue sodium concentration value averaged over lesions and over regions of normal-appearing white and grey matter was positively associated with T(2)-weighted (P < or = 0.001 for all) and T(1)-weighted (P < or = 0.006 for all) lesion volumes. In patients, only the tissue sodium concentration value averaged over regions of normal-appearing grey matter was negatively associated with the normalized grey matter volume (P = 0.0009). Finally, the expanded disability status scale score showed a mild, positive association with the mean tissue sodium concentration value in chronic lesions (P = 0.002), in regions of normal-appearing white matter (P = 0.004) and normal-appearing grey matter (P = 0.002). This study shows the feasibility of using in vivo sodium magnetic resonance imaging at 3 T in patients with multiple sclerosis. Our findings suggest that the abnormal values of the tissue sodium concentration in patients with relapsing-remitting multiple sclerosis might reflect changes in cellular composition of the lesions and/or changes in cellular and metabolic integrity. Sodium magnetic resonance imaging has the potential to provide insight into the pathophysiological mechanisms of tissue injury when correlation with histopathology becomes available.
Figures


Similar articles
-
Sodium accumulation is associated with disability and a progressive course in multiple sclerosis.Brain. 2013 Jul;136(Pt 7):2305-17. doi: 10.1093/brain/awt149. Brain. 2013. PMID: 23801742
-
Brain intra- and extracellular sodium concentration in multiple sclerosis: a 7 T MRI study.Brain. 2016 Mar;139(Pt 3):795-806. doi: 10.1093/brain/awv386. Epub 2016 Jan 20. Brain. 2016. PMID: 26792552
-
High field (9.4 Tesla) magnetic resonance imaging of cortical grey matter lesions in multiple sclerosis.Brain. 2010 Mar;133(Pt 3):858-67. doi: 10.1093/brain/awp335. Epub 2010 Jan 31. Brain. 2010. PMID: 20123726
-
Diffusion-weighted MR of the brain: methodology and clinical application.Radiol Med. 2005 Mar;109(3):155-97. Radiol Med. 2005. PMID: 15775887 Review. English, Italian.
-
Gray and normal-appearing white matter in multiple sclerosis: an MRI perspective.Expert Rev Neurother. 2007 Mar;7(3):271-9. doi: 10.1586/14737175.7.3.271. Expert Rev Neurother. 2007. PMID: 17341175 Review.
Cited by
-
Micro-diffusely abnormal white matter: An early multiple sclerosis lesion phase with intensified myelin blistering.Ann Clin Transl Neurol. 2024 Apr;11(4):973-988. doi: 10.1002/acn3.52015. Epub 2024 Feb 29. Ann Clin Transl Neurol. 2024. PMID: 38425098 Free PMC article.
-
Myopia, Sodium Chloride, and Vitreous Fluid Imbalance: A Nutritional Epidemiology Perspective.Epidemiologia (Basel). 2024 Jan 29;5(1):29-40. doi: 10.3390/epidemiologia5010003. Epidemiologia (Basel). 2024. PMID: 38390916 Free PMC article.
-
Hypertensive heart disease: risk factors, complications and mechanisms.Front Cardiovasc Med. 2023 Jun 5;10:1205475. doi: 10.3389/fcvm.2023.1205475. eCollection 2023. Front Cardiovasc Med. 2023. PMID: 37342440 Free PMC article. Review.
-
Super-resolution of sodium images from simultaneous 1 H MRF/23 Na MRI acquisition.NMR Biomed. 2023 Oct;36(10):e4959. doi: 10.1002/nbm.4959. Epub 2023 May 18. NMR Biomed. 2023. PMID: 37186038 Free PMC article.
-
Patterns of inflammation, microstructural alterations, and sodium accumulation define multiple sclerosis subtypes after 15 years from onset.Front Neuroinform. 2023 Mar 23;17:1060511. doi: 10.3389/fninf.2023.1060511. eCollection 2023. Front Neuroinform. 2023. PMID: 37035717 Free PMC article.
References
-
- Allen IV, McKeown SR. A histological, histochemical and biochemical study of the macroscopically normal white matter in multiple sclerosis. J Neurol Sci. 1979;41:81–91. - PubMed
-
- Allen IV, McQuaid S, Mirakhur M, Nevin G. Pathological abnormalities in the normal-appearing white matter in multiple sclerosis. Neurol Sci. 2001;22:141–4. - PubMed
-
- Balcer LJ. Clinical outcome measures for research in multiple sclerosis. J Neuroophthalmol. 2001;21:296–301. - PubMed
-
- Barkhof F, Bruck W, De Groot CJ, Bergers E, Hulshof S, Geurts J, et al. Remyelinated lesions in multiple sclerosis: magnetic resonance image appearance. Arch Neurol. 2003;60:1073–81. - PubMed
Publication types
MeSH terms
Substances
Grants and funding
LinkOut - more resources
Full Text Sources
Other Literature Sources

