Review
. 2010 Feb;34(1):3-19.
doi: 10.1053/j.semperi.2009.10.001.

Basic principles and concepts underlying recent advances in magnetic resonance imaging of the developing brain

Affiliations
Review

Basic principles and concepts underlying recent advances in magnetic resonance imaging of the developing brain

Ashok Panigrahy et al. Semin Perinatol. 2010 Feb.

Abstract

Over the last decade, magnetic resonance (MR) imaging has become an essential tool in the evaluation of both in vivo human brain development and perinatal brain injury. Recent technology including MR-compatible neonatal incubators, neonatal head coils, advanced MR pulse sequences, and 3-T field strength magnets allow high-quality MR imaging studies to be performed on sick neonates. This article will review basic principles and concepts underlying recent advances in MR spectroscopy, diffusion, perfusion, and volumetric MR imaging. These techniques provide quantitative assessment and novel insight of both brain development and brain injury in the immature brain. Knowledge of normal developmental changes in quantitative MR values is also essential to interpret pathologic cases.


Figures

Figure 1
Figure 1
The MR-compatible incubator used for clinical and research MRI studies in preterm and term neonates. The baby inside receives optimal humidity and temperature that is controlled from the backside of the system. The front part hosts the neonatal head coil specifically designed for preterm and term neonates and infants. Handling ports on the side allow support to the bed and the neonate; the rear handling port allows placement and removal of the head coil. Also shown is the MR-compatible ventilator and monitoring equipment. (From Panigrahy A, Bluml S, “Advances in magnetic resonance neuroimaging techniques in the evaluation of neonatal encephalopathy” in Topics in Magnetic Resonance Imaging, Vol. 18(1) page 4. Reprinted by permission of publisher, Wolters Kluwer Health/Lippincott, Williams & Wilkins)
Figure 2
Figure 2
PROPELLER (motion correction) T2 sequence in a term equivalent preterm infant. The image on the left show significant motion artifact with the conventional turbo spin echo T2 imaging which is corrected when the PROPELLER T2 imaging is performed (image on the right). The preterm infant has diffuse white matter hypoplasia.
Figure 3
Figure 3
Schematic showing the theoretical basis of the two major diffusion tensor metrics: mean diffusivity or ADC (left) and fractional anisotropy (right).
Figure 4
Figure 4
A comparison of the quantitative developmental changes in mean diffusivity or ADC, fractional anisotropy and relative anisotropy in the developing human frontal periventricular white matter in neonatal and pediatric patients with normal MR scans: there is a decrease in mean diffusivity in the frontal periventricular white matter with a concominent increase in fractional anisotropy in the same region. (Mean diffusivity is in mm2/s units on bottom graph). The bottom right graph shows a comparison of the quantitative developmental changes in the three eigenvalues in the developing human frontal periventricular white matter in neonatal and pediatric patients with normal MR scans: there is decrease in the three eigenvalues in the frontal periventricular white matter with first eigenvalue (maximum) higher in magnitude compared to the second (intermediate) and third (minimum) eigenvalue which are both closer in magnitude.
Figure 5
Figure 5
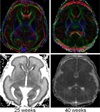
Diffusion tensor imaging of a preterm neonate (25 weeks gestation, 1 week old) with color direction specific [blue-cranial caudal, green-transverse, and red-anterior posterior] fractional anisotropy map (top left) and mean diffusivity map (bottom left) compared to a term neonate (right). There is direction specific increased anisotropy in the corpus callosum, anterior limb of the internal capsule and the posterior limb of the internal capsule (which are unmyelinated at this age). There is also evidence of increased anisotropy of the cerebral cortex which disappears by term age.
Figure 6
Figure 6
Diffusion tensor tractography of the newborn optic radiation comparing a continuous (FACT) technique (left) to a probabilistic technique (right) in the same patient.
Figure 7
Figure 7
Sample spectra and MR images of the developing grey and white matter from midgestation to term using short echo proton MR spectroscopy. There is an increase in NAA with a decrease in myo-inositol noted during the same time period.
Figure 8
Figure 8
Sample spectra and MR images of the developing grey and white matter in the first year of life using short echo proton MR spectroscopy. There is an increase in NAA with a decrease in choline noted during the same period.
Figure 9
Figure 9
Age dependent changes of N-acetylaspartate (NAA) and Myo-Inositol in parietal white matter: The maximum net increase of NAA is at 42 weeks. The most dramatic changes occur between 37 and 47 weeks when NAA increases from 31% to 67% of adult level. NAA reaches 90% of normal adult levels at 5 years. In contrast, the maximum net decrease of mI is at 41 weeks post-conceptional age. Time of fasted net decrease is between 33 and 56 weeks when mI decreases from 180% to 110% of adult levels. Myo-inositol reaches a minimum at 2 years and thereafter increases slightly.
Figure 10
Figure 10
Comparison of 3T with 1.5T MR spectroscopy for the differentiation of lactate, lipids, and propylene glycol. Two 3T spectra are depicted on the left and two 1.5T spectra are depicted on the right taken from the same brain region. Lactate demonstrates a characteristic doublet of two narrow lines 0.1 ppm apart centered at 1.33 ppm. Lipids form two broad peaks from the methyl and methylene groups at 0.9 and 1.3ppm. Propylene glycol has a similar pattern like lactate, however, the doublet is centered at approximately 1.1 ppm. These peaks resolve better using 3T imaging compare to 1.5T.
Figure 11
Figure 11
Processing Pipeline for Quantitative Short Echo Proton MRS.
Figure 12
Figure 12
Dynamic contrast susceptibility perfusion MR imaging in the neonatal brain showing a focal left ACA (anterior communicating artery) infarct in the acute phase. There is increased cerebral blood flow within the lesion.
Figure 13
Figure 13
Multiphase pulsed ASL in neonatal stroke. The mean diffusivity map (ADC map) on the left shows an acute right MCA infarct. The PASL study done at the same time shows a perfusion deficit in the areas of infarct during the very early phase. During the later phases, there is relatively increased perfusion in the areas of infarct which may be related to leptomeningeal collaterals and/or delayed re-perfusion.
Figure 14
Figure 14
Signals indicate responses as measured by NIRS and BOLD fMR when an adult subject was exposed to decreased fiO2. This experiment had two exposures, starting at time one minute and time three minutes. Optodes from a NIRO 200 were placed on the head at approximately the level shown at right, the ROI indicated was used to generate the curve for BOLD signal shown below at left. Note that the temporal calibration and the durations of exposure are approximate.
Figure 15
Figure 15
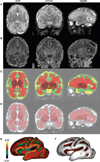
Volumetric and surface identification at birth for a newborn of 31 weeks gestation. Using T2 and T1 weighted images (A and B), post-processing enabled the classification of cerebral tissues for volumetric measurements (C) [green=cortex, red=unmyelinated white matter, orange=myelinated white matter, maroon=basal ganglia/thalami, yellow=cerebrospinal fluid] and the segmentation of the interface between cortex and white matter for surface measurements (D); Based on this segmentation, the inner cortical surface was reconstructed in 3D [(E) the surface curvature is colour-coded] and the cortical sulci were identified according to negative curvatures [(F) sulci are in purple], which enable the computation of the sulcation index. Reprinted with permission. (From Dubois J, Benders M, Borradori-Tolsa C, et al, “Primary cortical folding in the human newborn: an early marker of later functional development” in Brain, 2008 Vol. 131(8) page 2031. Reprinted by permission of publisher, Oxford University Press)
Figure 16
Figure 16
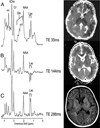
MRS and DTI in hypoxic-ischemic encephalopathy. Single-voxel MRS at three different echo times in the basal ganglia (right). Note the characteristic modulation of lactate. The top left figure is a spectrum acquired using short echo time (35ms) which shows a myoinositol peak (left side of the spectrum), elevated glutamine/glutamine peak next to a reduced NAA peak (middle spectrum), and a elevated lactate doublet next to a lipid peak (right side of the spectrum). The middle left figure is a spectrum acquired using long echo time (144ms) which show a lactate doublet peak inverted and reduced NAA, but non visualization of myo-inositol, glutamate and lipids. The middle figure is a spectrum acquired using longer echo time (244 ms) which is similar to 144 ms, except that the lactate doublet reverts to the other side of the spectrum. The mean diffusivity maps on the left show evolution of the “peripheral” pattern of neonatal hypoxic-ischemic brain injury. The top right image shows reduced mean diffusivity in the cortex, ventral lateral thalamus and caudate head two days after injury. The middle right image shows pseudo-normalization of the ADC signal in these regions seven days after injury in the same patients. The spin echo T1 imaging at 7 days (bottom right) shows the extent of cortical injury.
Figure 17
Figure 17
MR spectroscopy and DTI of perinatal white matter injury. The coronal T1 SPGR (left) shows multiple T1 non-cystic hyperintense lesion which correlate with areas of coagulation necrosis. The middle top and right images show abnormal diffusion signal with decreased mean diffusivity (ADC) within the lesion. The MRS short echo of the focal necrosis show reduced NAA and elevated lactate and lipids.

Similar articles

Cited by

References

    1. Ferriero DM. Neonatal brain injury. N Engl J Med. 2004;351:1985–1995. - PubMed
    1. Bluml S, Friedlich P, Erberich S, et al. MR imaging of newborns by using an MR-compatible incubator with integrated radiofrequency coils: initial experience. Radiology. 2004;231:594–601. - PubMed
    1. Dumoulin CL, Rohling KW, Piel JE, et al. Magnetic resonance imaging compatible neonate incubator. Concepts Magn Reson. 2002;15:117–128.
    1. Mathur AM, Neil JL, McKinstry RC, et al. Transport, monitoring, and successful MR imaging in unsedated neonates. Pediatr Rad. 2008;38:260–264. - PubMed
    1. Forbes KPN, Pipe JG, Bird CR, et al. PROPELLER MRI: clinical testing of a novel technique for quantification and compensation of head motion. J Magn Reson Imaging. 2001;14:215–222. - PubMed

Publication types

MeSH terms