. 2010 Mar;42(3):224-8.
doi: 10.1038/ng.522. Epub 2010 Jan 24.

A genome-wide association study identifies pancreatic cancer susceptibility loci on chromosomes 13q22.1, 1q32.1 and 5p15.33

Affiliations

A genome-wide association study identifies pancreatic cancer susceptibility loci on chromosomes 13q22.1, 1q32.1 and 5p15.33

Gloria M Petersen et al. Nat Genet. 2010 Mar.

Abstract

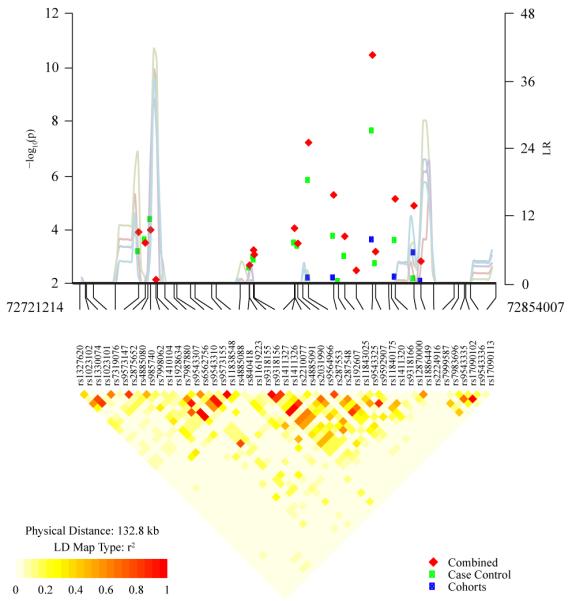
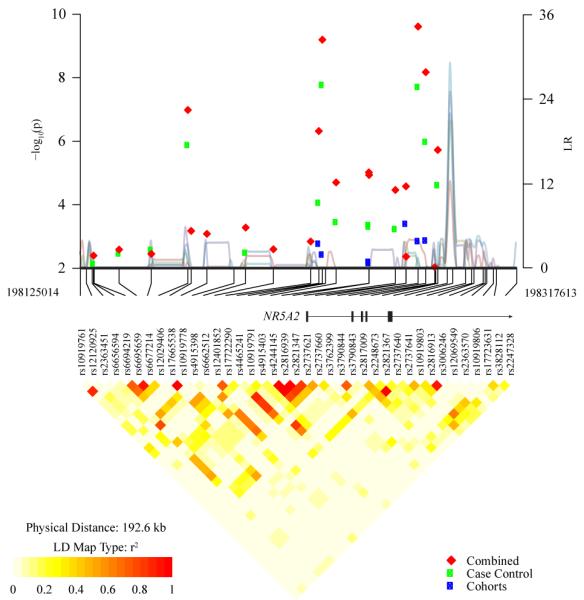
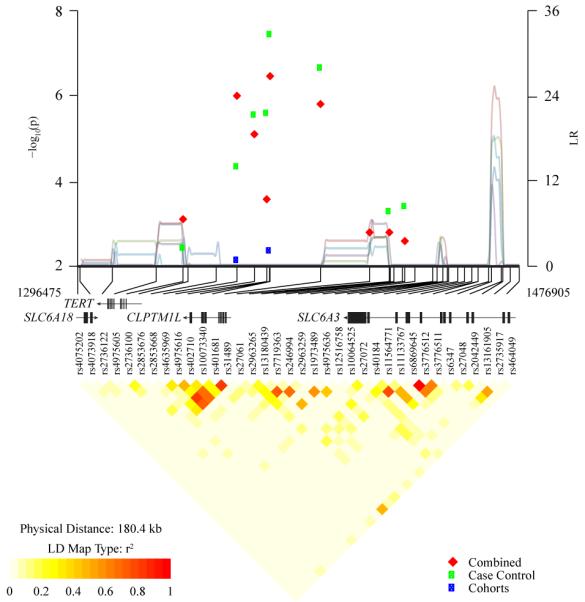
We conducted a genome-wide association study of pancreatic cancer in 3,851 affected individuals (cases) and 3,934 unaffected controls drawn from 12 prospective cohort studies and 8 case-control studies. Based on a logistic regression model for genotype trend effect that was adjusted for study, age, sex, self-described ancestry and five principal components, we identified eight SNPs that map to three loci on chromosomes 13q22.1, 1q32.1 and 5p15.33. Two correlated SNPs, rs9543325 (P = 3.27 x 10(-11), per-allele odds ratio (OR) 1.26, 95% CI 1.18-1.35) and rs9564966 (P = 5.86 x 10(-8), per-allele OR 1.21, 95% CI 1.13-1.30), map to a nongenic region on chromosome 13q22.1. Five SNPs on 1q32.1 map to NR5A2, and the strongest signal was at rs3790844 (P = 2.45 x 10(-10), per-allele OR 0.77, 95% CI 0.71-0.84). A single SNP, rs401681 (P = 3.66 x 10(-7), per-allele OR 1.19, 95% CI 1.11-1.27), maps to the CLPTM1L-TERT locus on 5p15.33, which is associated with multiple cancers. Our study has identified common susceptibility loci for pancreatic cancer that warrant follow-up studies.


Figures

Figure 1
Figure 1. Association Results, Recombination and Linkage Disequilibrium Plots for 13q22.1, 1q32.1, and 5p15.33
Association results are shown in the top panel for all cohort studies (blue squares), case-control studies (green squares) and all studies combined (red diamonds). Overlaid on the association panel for each locus is a plot of recombination rates (cM/Mb) across the region from CEU study controls. A. The LD plot shows a region of chromosome 13q22.1 marked by SNPs, rs9543325 and rs9564966 and bounded by SNPs between chromosome 13q22.1:72,721,214-72,854,007. These SNPs are within a 600 kb intergenic region between KLF5 and KLF12. B. The LD plot shows a region of chromosome 1q32.1 marked by 5 SNPs, rs3790844, rs10919791, rs3790843, rs12029406 and rs4465241 and bounded by SNPs between chromosome 1q32.1:198,125,014-198,317,613. Note that rs3790844 and rs3790843are located in the first intron of the NR5A2 gene, shown above the LD plot. C. The LD plot shows a region of chromosome 5p15.33 marked by rs401681and bounded by SNPs between chr5p15.33: 1,296,475-1,476,905. rs401681 is located in the 13th intron of the CLPTM1L gene, shown above the LD plot and 27 kb from the TERT gene. For all panels, LD (r2) is depicted for SNPs with MAF > 5% using PanScan Controls of European background (n=3,650 unrelated individuals). Locations are from NCBI Genome Build 36.

Similar articles

  • A resequence analysis of genomic loci on chromosomes 1q32.1, 5p15.33, and 13q22.1 associated with pancreatic cancer risk.
    Parikh H, Jia J, Zhang X, Chung CC, Jacobs KB, Yeager M, Boland J, Hutchinson A, Burdett L, Hoskins J, Risch HA, Stolzenberg-Solomon RZ, Chanock SJ, Wolpin BM, Petersen GM, Fuchs CS, Hartge P, Amundadottir L. Parikh H, et al. Pancreas. 2013 Mar;42(2):209-15. doi: 10.1097/MPA.0b013e318264cea5. Pancreas. 2013. PMID: 23295781 Free PMC article.
  • Three new pancreatic cancer susceptibility signals identified on chromosomes 1q32.1, 5p15.33 and 8q24.21.
    Zhang M, Wang Z, Obazee O, Jia J, Childs EJ, Hoskins J, Figlioli G, Mocci E, Collins I, Chung CC, Hautman C, Arslan AA, Beane-Freeman L, Bracci PM, Buring J, Duell EJ, Gallinger S, Giles GG, Goodman GE, Goodman PJ, Kamineni A, Kolonel LN, Kulke MH, Malats N, Olson SH, Sesso HD, Visvanathan K, White E, Zheng W, Abnet CC, Albanes D, Andreotti G, Brais L, Bueno-de-Mesquita HB, Basso D, Berndt SI, Boutron-Ruault MC, Bijlsma MF, Brenner H, Burdette L, Campa D, Caporaso NE, Capurso G, Cavestro GM, Cotterchio M, Costello E, Elena J, Boggi U, Gaziano JM, Gazouli M, Giovannucci EL, Goggins M, Gross M, Haiman CA, Hassan M, Helzlsouer KJ, Hu N, Hunter DJ, Iskierka-Jazdzewska E, Jenab M, Kaaks R, Key TJ, Khaw KT, Klein EA, Kogevinas M, Krogh V, Kupcinskas J, Kurtz RC, Landi MT, Landi S, Le Marchand L, Mambrini A, Mannisto S, Milne RL, Neale RE, Oberg AL, Panico S, Patel AV, Peeters PH, Peters U, Pezzilli R, Porta M, Purdue M, Quiros JR, Riboli E, Rothman N, Scarpa A, Scelo G, Shu XO, Silverman DT, Soucek P, Strobel O, Sund M, Małecka-Panas E, Taylor PR, Tavano F, Travis RC, Thornquist M, Tjønneland A, Tobias GS, Trichopoulos D, Vashist Y, Vodicka P, Wactawski-Wende J, Wentzensen N, Yu H, Yu K… See abstract for full author list ➔ Zhang M, et al. Oncotarget. 2016 Oct 11;7(41):66328-66343. doi: 10.18632/oncotarget.11041. Oncotarget. 2016. PMID: 27579533 Free PMC article.
  • Common variation at 2p13.3, 3q29, 7p13 and 17q25.1 associated with susceptibility to pancreatic cancer.
    Childs EJ, Mocci E, Campa D, Bracci PM, Gallinger S, Goggins M, Li D, Neale RE, Olson SH, Scelo G, Amundadottir LT, Bamlet WR, Bijlsma MF, Blackford A, Borges M, Brennan P, Brenner H, Bueno-de-Mesquita HB, Canzian F, Capurso G, Cavestro GM, Chaffee KG, Chanock SJ, Cleary SP, Cotterchio M, Foretova L, Fuchs C, Funel N, Gazouli M, Hassan M, Herman JM, Holcatova I, Holly EA, Hoover RN, Hung RJ, Janout V, Key TJ, Kupcinskas J, Kurtz RC, Landi S, Lu L, Malecka-Panas E, Mambrini A, Mohelnikova-Duchonova B, Neoptolemos JP, Oberg AL, Orlow I, Pasquali C, Pezzilli R, Rizzato C, Saldia A, Scarpa A, Stolzenberg-Solomon RZ, Strobel O, Tavano F, Vashist YK, Vodicka P, Wolpin BM, Yu H, Petersen GM, Risch HA, Klein AP. Childs EJ, et al. Nat Genet. 2015 Aug;47(8):911-6. doi: 10.1038/ng.3341. Epub 2015 Jun 22. Nat Genet. 2015. PMID: 26098869 Free PMC article.
  • Genome-wide association study identifies five new susceptibility loci for prostate cancer in the Japanese population.
    Takata R, Akamatsu S, Kubo M, Takahashi A, Hosono N, Kawaguchi T, Tsunoda T, Inazawa J, Kamatani N, Ogawa O, Fujioka T, Nakamura Y, Nakagawa H. Takata R, et al. Nat Genet. 2010 Sep;42(9):751-4. doi: 10.1038/ng.635. Epub 2010 Aug 1. Nat Genet. 2010. PMID: 20676098
  • Novel genetic variants in the chromosome 5p15.33 region associate with lung cancer risk.
    Pande M, Spitz MR, Wu X, Gorlov IP, Chen WV, Amos CI. Pande M, et al. Carcinogenesis. 2011 Oct;32(10):1493-9. doi: 10.1093/carcin/bgr136. Epub 2011 Jul 18. Carcinogenesis. 2011. PMID: 21771723 Free PMC article.

Cited by

References

    1. Ferlay J, Bray F, Pisani P, Parkin DM. IARC CancerBase. No. 5. IARCPress; Lyon: 2004. GLOBOCAN 2002: Cancer Incidence, Mortality and Prevalence Worldwide.
    1. Anderson KE,MT, Silverman D. Cancer of the pancreas. In: Schottenfeld D, Fraumeni JJ, editors. Cancer Epidemiology and Prevention. Oxford University Press; New York: 2006.
    1. Shi C, Hruban RH, Klein AP. Familial pancreatic cancer. Arch Pathol Lab Med. 2009;133:365–74. - PMC - PubMed
    1. Jones S, et al. Exomic sequencing identifies PALB2 as a pancreatic cancer susceptibility gene. Science. 2009;324:217. - PMC - PubMed
    1. Tischkowitz MD, et al. Analysis of the gene coding for the BRCA2-interacting protein PALB2 in familial and sporadic pancreatic cancer. Gastroenterology. 2009;137:1183–6. - PMC - PubMed