. 2010 Jan 19;5(1):e8774.
doi: 10.1371/journal.pone.0008774.

Microtubules regulate migratory polarity through Rho/ROCK signaling in T cells

Affiliations

Microtubules regulate migratory polarity through Rho/ROCK signaling in T cells

Aya Takesono et al. PLoS One. .

Abstract

Background: Migrating leukocytes normally have a polarized morphology with an actin-rich lamellipodium at the front and a uropod at the rear. Microtubules (MTs) are required for persistent migration and chemotaxis, but how they affect cell polarity is not known.

Methodology/principal findings: Here we report that T cells treated with nocodazole to disrupt MTs are unable to form a stable uropod or lamellipodium, and instead often move by membrane blebbing with reduced migratory persistence. However, uropod-localized receptors and ezrin/radixin/moesin proteins still cluster in nocodazole-treated cells, indicating that MTs are required specifically for uropod stability. Nocodazole stimulates RhoA activity, and inhibition of the RhoA target ROCK allows nocodazole-treated cells to re-establish lamellipodia and uropods and persistent migratory polarity. ROCK inhibition decreases nocodazole-induced membrane blebbing and stabilizes MTs. The myosin inhibitor blebbistatin also stabilizes MTs, indicating that RhoA/ROCK act through myosin II to destabilize MTs.

Conclusions/significance: Our results indicate that RhoA/ROCK signaling normally contributes to migration by affecting both actomyosin contractility and MT stability. We propose that regulation of MT stability and RhoA/ROCK activity is a mechanism to alter T-cell migratory behavior from lamellipodium-based persistent migration to bleb-based migration with frequent turning.


Conflict of interest statement

Competing Interests: The authors have declared that no competing interests exist.

Figures

Figure 1
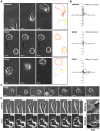
Figure 1. Microtubule dynamics are required for stable T cell migratory polarity.
CCRF-CEM T cells were pre-treated with or without 10 µM taxol for 30 min or 20 µM nocodazole for 10 min, plated on ICAM-1-coated dishes, and stimulated with 1 nM CXCL12. Cell migration was monitored by time-lapse microscopy. (A) Frames from movies of control, taxol or nocodazole-treated CCRF-CEM cells at 0, 4 and 8 min are shown. Outlines of the cells at 0 (gray), 4 (yellow) and 8 (red) min reveal the migrating paths. Bars = 10 µm. (B) Migration tracks of cells (10 to 16 cells for each condition) are displayed as direction plots. The mean migration speed of cells ± SEM is shown. Data shown are representative of 4 independent experiments. (C) Frames of a nocodazole-treated CCRF-CEM cell (Movie S8). White arrowheads indicate bleb-like protrusions. (D) Frames of a control (top panels; Movie S4) and nocodazole-treated (bottom panels; Movie S5) CCRF-CEM cell are shown. Right panels show kymographs of the region marked by the white bar in the left panels. White arrows (bottom panel) indicate extension of progressive blebs. Bar = 10 µm.
Figure 2
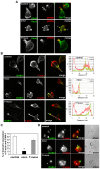
Figure 2. Microtubule dynamics are required for polarized distribution of F-actin.
CCRF-CEM cells were pre-treated with or without taxol or nocodazole, plated on ICAM-1, and then stimulated with 20 nM CXCL12 for 5 min. Cells were fixed and stained with anti-α-tubulin antibody (green) and TRITC-conjugated phalloidin to show actin filaments (red). Representative confocal images are shown. Bar = 10 µm. The white arrows in nocodazole-treated cells indicate bleb-like membrane protrusions.
Figure 3
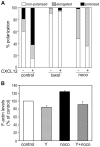
Figure 3. Effects of microtubule-disrupting agents on T-cell polarization and F-actin levels.
(A) Quantification of T cell polarization. T cell morphology was classified in 3 categories: 1) non-polarized (white), where the cells had a spherical morphology, 2) elongated (gray), where the cells had an elongated cell shape but no diametric polarization of F-actin and α-tubulin, and 3) migratory polarized (black), where the cells were elongated and had diametric distribution of F-actin at the leading edge and the MTOC (identified with anti-α-tubulin antibody) behind the nucleus; n = 110 to 150 cells for each condition from 3 independent experiments. (B) Nocodazole alters F-actin levels in T cells. Flow cytometric analysis of the F-actin content of CCRF-CEM cells incubated with 10 µM Y-27632 for 30 min and/or 20 µM nocodazole for 10 min. Data are shown as a percentage of the mean fluorescence of untreated cells. Data are the mean of three independent experiments +/− SEM. *p<0.05 compared to control cells.
Figure 4
Figure 4. Microtubule-disrupting agents do not affect polarized clustering of uropod proteins.
CCRF-CEM cells were pre-treated with or without 10 µM taxol for 30 min or 20 µM nocodazole for 10 min, plated on ICAM-1, and then stimulated with 20 nM CXCL12 for 5 min before fixation. (A) Cells were stained with anti-ICAM-3 antibody (green) and phalloidin to show actin filaments (red). Small uropod-like protrusions where ICAM-3 accumulates in nocodazole-treated cells are indicated with white asterisks. Representative confocal images are shown. (B) Cells were stained with anti-RhoA antibody (green) and anti-phospho-ERM antibody (red). Bleb-like membrane protrusions are indicated with white arrows and small uropod-like protrusions where brighter phospho-ERM staining is observed are shown with white asterisks in nocodazole-treated cells. Bar = 10 µm.
Figure 5
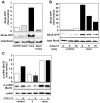
Figure 5. Microtubule depolymerization induces RhoA activation.
(A) Cells were pretreated with or without 10 µM taxol for 30 min and subsequently with or without 20 µM nocodazole (noco) for 10 min, plated on ICAM-1 for 5 min, then lysed to determine the levels of active GTP-bound RhoA by a GST-Rhotekin-RBD pulldown assay. The graph represents a quantification of densitometry results, normalised to total RhoA and indicated as fold increase in RhoA-GTP over the level in control cells. Data shown are representative of 3 independent experiments. (B) CCRF-CEM cells were pre-treated with (black) or without (white) 20 µM nocodazole (noco) for 10 min, plated on ICAM-1, then stimulated with 50 nM CXCL12 for the indicated time periods. Levels of active GTP-bound RhoA were determined by a GST-Rhotekin-RBD pulldown assay. The graph represents a quantification of densitometry results, normalised to total RhoA and indicated as fold increase in RhoA-GTP over the level in resting control cells (0 min). Data shown are representative of 4 independent experiments. (C) Western blot of phospho-cofilin and total cofilin. CCRF-CEM cells were treated with 10 µM Y-27632 (Y) for 30 min or 20 µM nocodazole (noco) for 10 min, plated on ICAM-1 then stimulated with 50 nM CXCL12 for 5 min, lysed and analysed by western blotting using anti-phospho-cofilin (Ser3) antibody and cofilin antibody. Data represent quantification of densitometry results from 3 independent experiments (Mean ± SD), normalised to total cofilin and indicated as fold increase in phospho-cofilin over the level in untreated control cells.
Figure 6
Figure 6. The effect of nocodazole on T-cell migration is rescued by Y-27632.
CCRF-CEM T cells were treated with or without 10 µM Y-27632 for 30 min and subsequently with or without 20 µM nocodazole (noco) for 10 min, then stimulated with 1 nM CXCL12 on ICAM-1-coated dishes. (A) Cell migration was monitored by time-lapse microscopy. Examples of cell trajectories of 10 to 15 cells are shown and mean migration speed ± SEM (n = 10–15). (B) Migration parameters were calculated from cell tracks. The kinetic data of 30 to 40 cells in each condition from three independent experiments are shown. *p<0.05, compared to control cells, or #p<0.05 compared to nocodazole-treated cells, indicated with bridges, Student's t-test. (C) Chemotaxis of CCRF-CEM cells towards CXCL12. Cells were pre-incubated with 10 µM Y-27632 for 30 min and/or 20 µM nocodazole for the 10 min before adding to ICAM-coated transwells. Migrated cells were counted after 60 min. **p<0.01, compared to control cells, or #p<0.05 compared to nocodazole-treated cells, indicated with bridge, ANOVA. (D) CCRF-CEM cell migration was monitored by time-lapse microscopy. Y-27632 (10 µM) was added to nocodazole-treated cells (20 µM) (noco) at 12 min (Movie S9; bottom panels). A control migrating cell is marked with an asterisk (top panels). White arrow indicates a tail induced following Y-27632 addition; white arrowhead indicates restored lamellipodium. Bar = 10 µm.
Figure 7
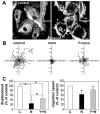
Figure 7. Y-27632 rescues the effect of nocodazole on endothelial cell migration.
(A) Nocodazole induces membrane blebbing in HUVECs. Nocodazole (noco, 0.2 µM) was added to HUVECs for 30 min, then cells were fixed and stained with phalloidin to show actin filaments. (B) Y-27632 rescues the effect of nocodazole on HUVEC migration. Y-27632 (Y, 5 µM) and 0.2 µM nocodazole (noco) were added to HUVECs 15 min before the acquisition of time-lapse movies. The migration tracks of 90 to 100 cells from three independent experiments were analysed. Examples of cell trajectories of 30 cells in each condition are shown. (C) Migration parameters for HUVECs were calculated from cell tracks; % of control displacement and migration speed were evaluated from cells that had migrated a distance of 50 µm or more from the starting point during 5 h in (B). *p<0.05, compared to control cells, or #p<0.05 compared to nocodazole-treated cells, indicated with bridges, Student's t-test.
Figure 8
Figure 8. Y-27632 restores migratory polarity to nocodazole-treated cells.
(A) CCRF-CEM cells were treated with or without 10 µM Y-27632 (Y) and 20 µM nocodazole (noco) then plated on ICAM-1 and stimulated with 20 nM CXCL12 for 5 min. Cells were fixed and stained with anti-RhoA antibody (green) and anti-phospho-ERM antibody (red). Representative confocal projection images reconstructed from z-stacks of 15 to 25 frames with 0.4 µm interval are shown. Note that Y-27632 prevents nocodazole-induced membrane blebbing (indicated with white arrows) and restricts phospho-ERMs to the uropod. Bar = 10 µm. (B) Localization of F-actin (red) and ICAM-3 (green) in CXCL12-stimulated CCRF-CEM cells on ICAM-1. Cells were pre-treated with 20 µM nocodazole (noco) and 10 µM Y-27632 (Y) as indicated. Representative confocal images and line-plot graphs of subcellular distributions of F-actin and ICAM-3 in each condition. Line-plot graphs indicate fluorescent intensity (FI) of phalloidin (F-actin) (red) and ICAM-3 (green) along the white arrows indicated in merge images. (C) Percentage of CCRF-CEM cells with diametric polarization of F-actin and ICAM-3. Data are from n = 220 to 250 cells in each condition which are collected from 3 independent experiments and represent mean ± SD. *p<0.03, compared to control cells, Student's t-test. (D) CCRF-CEM cells were treated with or without 10 µM Y-27632 (Y) for 30 min and subsequently with or without 20 µM nocodazole (noco) for 10 min, incubated with latex-beads coated with ICAM-1 (5 µg/ml) and CXCL12 (20 nM), and then fixed and stained with phalloidin to show actin filaments (red) and anti-ICAM-3 antibody (green). Representative images are shown. Asterisks indicate the bead-cell contact sites.
Figure 9
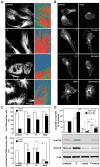
Figure 9. ROCK inhibitors increase microtubule stability.
(A) HUVECs were left untreated (control) or were incubated with 0.1 µM nocodazole for 60 min (noco) and/or 5 µM Y-27632 (Y) for 15 min then 0.1 µM nocodazole for 60 min (Y+noco). To visualize MT distribution, cells were extracted with 0.05% Triton X-100 to remove monomeric tubulin, then stained with anti-α-tubulin antibodies. The areas marked with a white rectangle have been enlarged and pseudocoloured using the image analysis program LaserPix to help visualise MT morphology in untreated and treated cells. (B, C) CCRF-CEM cells were treated with or without 10 µM Y-27632 (Y), 0.4 µM H-1152 (H) or 50 µM blebbistatin (bleb) for 30 min, then with or without 20 µM nocodazole (noco) for 10 min, then plated on ICAM-1 and stimulated with 20 nM CXCL12 for 5 min. Localization of acetylated tubulin (Ace-TUB) was examined by staining with anti-Ace-TUB antibody. (B) Representative confocal images; the outline of cells is indicated by white lines; (C) percentage of filamentous Ace-TUB positive cells (top), and % of morphologically polarized cells (with uropod and a leading edge) containing filamentous Ace-TUB (bottom). Data represent mean ± SEM from 3 independent experiments, n = 150 to 250 cells in each condition, ##p<0.01 for % of Ace-TUB positive cells compared to nocodazole-treated cells in the top panel, **p<0.01 for % of morphologically polarized cells compared to untreated control, or #p<0.05 compared to nocodazole-treated cells, to Y-27632+nocodazole-treated cells or to H-1152+nocodazole-treated cells (indicated with bridge), Student's t-test. (D) Western blot analysis of Ace-TUB and Glu-TUB levels in CCRF-CEM T cell lysates treated with or without 10 µM Y-27632 (Y) for 30 min and subsequently with or without 20 µM nocodazole (noco) for 10 min. Data represent quantification of densitometry results (Mean ± SD) of three independent experiments, normalised to the total α-TUB level and indicated as fold increase in Ace-TUB or Glu-TUB over the level in control cells; *p<0.05, **p<0.01 for Ace-TUB, or #p<0.05, #p<0.01 for Glu-TUB compared to control (without bridge), or to nocodazole-treated cells (indicated with bridge); Student's t-test.
Figure 10
Figure 10. Model for roles of microtubules and ROCKs in T-cell polarity and migration.
(A) T cell migration is stimulated by CXCL12. Migrating T cells have a lamellipodium at the front and uropod with uropod-localized proteins (e.g. ICAM-3, phosphorylated ERM proteins) at the back. Our results suggest that ROCKs reduces MT stability in the uropod and could inhibit cofilin activity in the lamellipodium. (B) Microtubule (MT) depolymerization, for example by nocodazole, releases a RhoGEF for RhoA, which increases the level of GTP-bound active RhoA. RhoA then stimulates ROCKs, which stimulate contractility and membrane blebbing and decreases microtubule stability. Inhibition of ROCKs reduces blebbing, increases stable MT, and reduces cofilin phosphorylation, thereby restoring lamellipodial/uropod polarity.

Similar articles

Cited by

References

    1. Sanchez-Madrid F, del Pozo MA. Leukocyte polarization in cell migration and immune interactions. EMBO J. 1999;18:501–511. - PMC - PubMed
    1. Hogg N, Smith A, McDowall A, Giles K, Stanley P, et al. How T cells use LFA-1 to attach and migrate. Immunol Lett. 2004;92:51–54. - PubMed
    1. Smith A, Bracke M, Leitinger B, Porter JC, Hogg N. LFA-1-induced T cell migration on ICAM-1 involves regulation of MLCK-mediated attachment and ROCK-dependent detachment. J Cell Sci. 2003;116:3123–3133. - PubMed
    1. Cahalan MD, Parker I. Choreography of cell motility and interaction dynamics imaged by two-photon microscopy in lymphoid organs. Annu Rev Immunol. 2008;26:585–626. - PMC - PubMed
    1. Smith A, Carrasco YR, Stanley P, Kieffer N, Batista FD, et al. A talin-dependent LFA-1 focal zone is formed by rapidly migrating T lymphocytes. J Cell Biol. 2005;170:141–151. - PMC - PubMed

Publication types