Deafness and retinal degeneration in a novel USH1C knock-in mouse model
- PMID: 20095043
- PMCID: PMC2925250
- DOI: 10.1002/dneu.20771
Deafness and retinal degeneration in a novel USH1C knock-in mouse model
Abstract
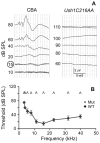
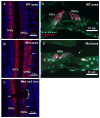
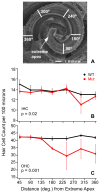
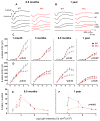
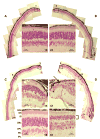
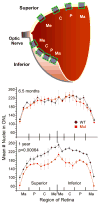
Usher syndrome is the leading cause of combined deaf-blindness, but the molecular mechanisms underlying the auditory and visual impairment are poorly understood. Usher I is characterized by profound congenital hearing loss, vestibular dysfunction, and progressive retinitis pigmentosa beginning in early adolescence. Using the c.216G>A cryptic splice site mutation in Exon 3 of the USH1C gene found in Acadian Usher I patients in Louisiana, we constructed the first mouse model that develops both deafness and retinal degeneration. The same truncated mRNA transcript found in Usher 1C patients is found in the cochleae and retinas of these knock-in mice. Absent auditory-evoked brainstem responses indicated that the mutant mice are deaf at 1 month of age. Cochlear histology showed disorganized hair cell rows, abnormal bundles, and loss of both inner and outer hair cells in the middle turns and at the base. Retinal dysfunction as evident by an abnormal electroretinogram was seen as early as 1 month of age, with progressive loss of rod photoreceptors between 6 and 12 months of age. This knock-in mouse reproduces the dual sensory loss of human Usher I, providing a novel resource to study the disease mechanism and the development of therapies.
Figures

Similar articles
-
The Time Course of Deafness and Retinal Degeneration in a Kunming Mouse Model for Usher Syndrome.PLoS One. 2016 May 17;11(5):e0155619. doi: 10.1371/journal.pone.0155619. eCollection 2016. PLoS One. 2016. PMID: 27186975 Free PMC article.
-
Ush1c216A knock-in mouse survives Katrina.Mutat Res. 2007 Mar 1;616(1-2):139-44. doi: 10.1016/j.mrfmmm.2006.11.006. Epub 2006 Dec 15. Mutat Res. 2007. PMID: 17174357
-
Ames Waltzer deaf mice have reduced electroretinogram amplitudes and complex alternative splicing of Pcdh15 transcripts.Invest Ophthalmol Vis Sci. 2006 Jul;47(7):3074-84. doi: 10.1167/iovs.06-0108. Invest Ophthalmol Vis Sci. 2006. PMID: 16799054
-
Molecular basis of human Usher syndrome: deciphering the meshes of the Usher protein network provides insights into the pathomechanisms of the Usher disease.Exp Eye Res. 2006 Jul;83(1):97-119. doi: 10.1016/j.exer.2005.11.010. Epub 2006 Mar 20. Exp Eye Res. 2006. PMID: 16545802 Review.
-
The retinal phenotype of Usher syndrome: pathophysiological insights from animal models.C R Biol. 2014 Mar;337(3):167-77. doi: 10.1016/j.crvi.2013.12.004. Epub 2014 Mar 20. C R Biol. 2014. PMID: 24702843 Review.
Cited by
-
Adeno-associated virus gene replacement for recessive inner ear dysfunction: Progress and challenges.Hear Res. 2020 Sep 1;394:107947. doi: 10.1016/j.heares.2020.107947. Epub 2020 Mar 18. Hear Res. 2020. PMID: 32247629 Free PMC article. Review.
-
Fetal gene therapy and pharmacotherapy to treat congenital hearing loss and vestibular dysfunction.Hear Res. 2020 Sep 1;394:107931. doi: 10.1016/j.heares.2020.107931. Epub 2020 Mar 5. Hear Res. 2020. PMID: 32173115 Free PMC article. Review.
-
Sound strategies for hearing restoration.Science. 2014 May 9;344(6184):1241062. doi: 10.1126/science.1241062. Science. 2014. PMID: 24812404 Free PMC article. Review.
-
Antisense oligonucleotide therapy rescues disruptions in organization of exploratory movements associated with Usher syndrome type 1C in mice.Behav Brain Res. 2018 Feb 15;338:76-87. doi: 10.1016/j.bbr.2017.10.012. Epub 2017 Oct 14. Behav Brain Res. 2018. PMID: 29037661 Free PMC article.
-
The usherin mutation c.2299delG leads to its mislocalization and disrupts interactions with whirlin and VLGR1.Nat Commun. 2023 Feb 21;14(1):972. doi: 10.1038/s41467-023-36431-1. Nat Commun. 2023. PMID: 36810733 Free PMC article.
References
-
- Adato A, Lefevre G, Delprat B, Michel V, Michalski N, Chardenoux S, Weil D, El-Amraoui A, Petit C. Usherin, the defective protein in Usher syndrome type IIA, is likely to be a component of interstereocilia ankle links in the inner ear sensory cells. Hum Mol Genet. 2005;14:3921–3932. - PubMed
-
- Adato A, Michel V, Kikkawa Y, Reiners J, Alagramam KN, Weil D, Yonekawa H, Wolfrum U, El-Amraoui A, Petit C. Interactions in the network of Usher syndrome type 1 proteins. Hum Mol Genet. 2005;14:347–356. - PubMed
-
- Adato A, Vreugde S, Joensuu T, Avidan N, Hamalainen R, Belenkiy O, Olender T, Bonne-Tamir B, Ben-Asher E, Espinos C, Millan JM, Lehesjoki AE, Flannery JG, Avraham KB, Pietrokovski S, Sankila EM, Beckmann JS, Lancet D. USH3A transcripts encode clarin-1, a four-transmembrane-domain protein with a possible role in sensory synapses. Eur J Hum Genet. 2002;10:339–350. - PubMed
Publication types
MeSH terms
Substances
Grants and funding
- 5P20RR016816/RR/NCRR NIH HHS/United States
- P30 DC004661/DC/NIDCD NIH HHS/United States
- R01 DC002739/DC/NIDCD NIH HHS/United States
- P30 DC004661-01/DC/NIDCD NIH HHS/United States
- P30 HD002274/HD/NICHD NIH HHS/United States
- R01 DC003944/DC/NIDCD NIH HHS/United States
- P20 RR016816-01/RR/NCRR NIH HHS/United States
- R01 DC003944-01A1/DC/NIDCD NIH HHS/United States
- P30 HD002274-40/HD/NICHD NIH HHS/United States
- R01 DC002739-04A1/DC/NIDCD NIH HHS/United States
- P20 RR016816/RR/NCRR NIH HHS/United States
- R01 DC03944/DC/NIDCD NIH HHS/United States
LinkOut - more resources
Full Text Sources
Other Literature Sources
Medical
Molecular Biology Databases

