
The genetic landscape of a cell

Michael Costanzo et al. Science. .

Abstract

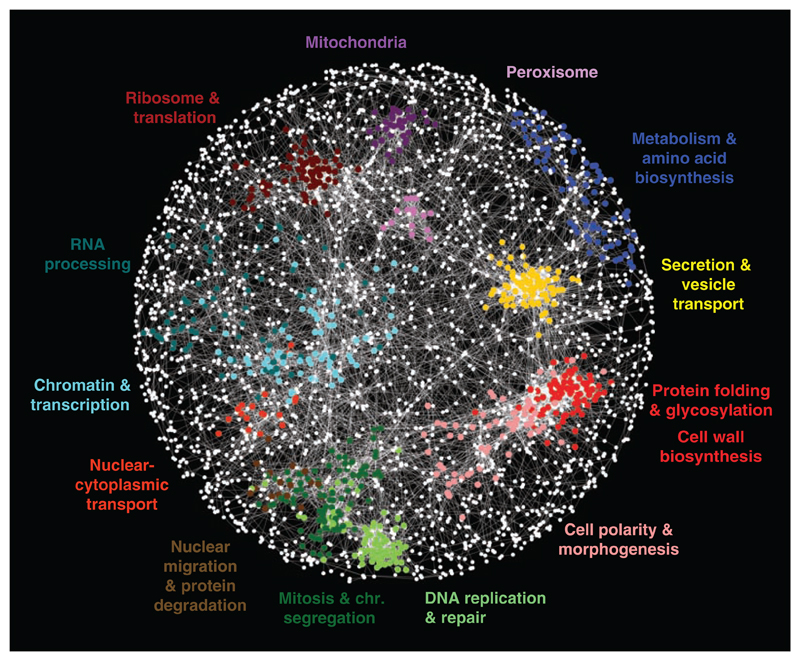
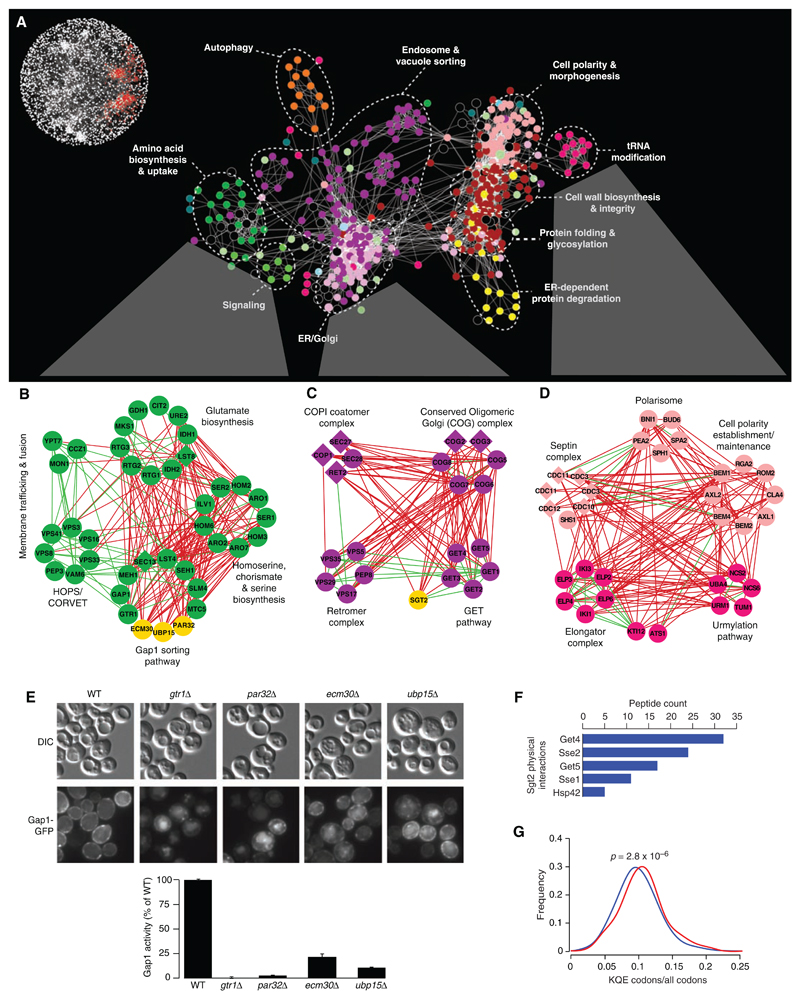
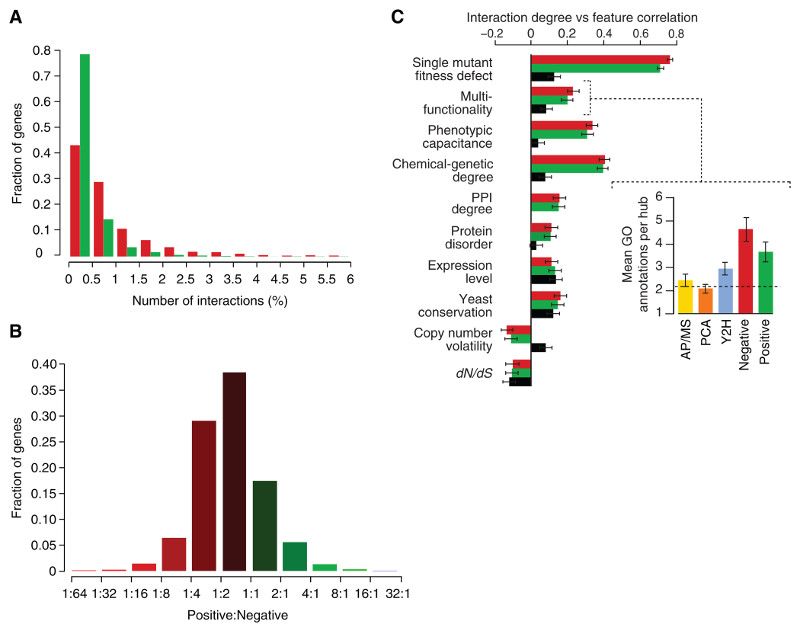
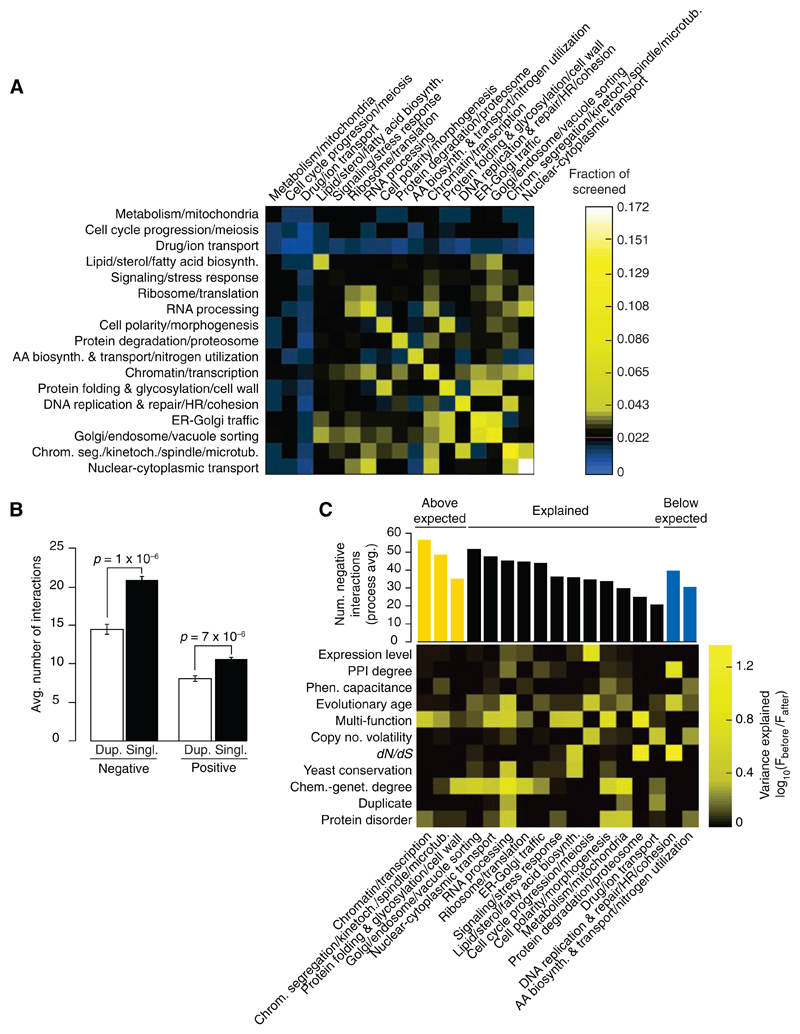
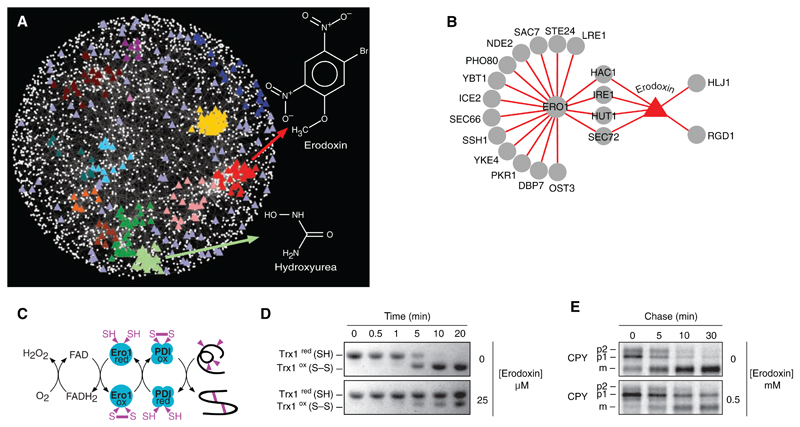
A genome-scale genetic interaction map was constructed by examining 5.4 million gene-gene pairs for synthetic genetic interactions, generating quantitative genetic interaction profiles for approximately 75% of all genes in the budding yeast, Saccharomyces cerevisiae. A network based on genetic interaction profiles reveals a functional map of the cell in which genes of similar biological processes cluster together in coherent subsets, and highly correlated profiles delineate specific pathways to define gene function. The global network identifies functional cross-connections between all bioprocesses, mapping a cellular wiring diagram of pleiotropy. Genetic interaction degree correlated with a number of different gene attributes, which may be informative about genetic network hubs in other organisms. We also demonstrate that extensive and unbiased mapping of the genetic landscape provides a key for interpretation of chemical-genetic interactions and drug target identification.


Figures

Fig. 1
Fig. 1
A correlation-based network connecting genes with similar genetic interaction profiles. Genetic profile similarities were measured for all gene pairs by computing Pearson correlation coefficients (PCCs) from the complete genetic interaction matrix. Gene pairs whose profile similarity exceeded a PCC > 0.2 threshold were connected in the network and laid out using an edge-weighted, spring-embedded, network layout algorithm (7, 8). Genes sharing similar patterns of genetic interactions are proximal to each other; less-similar genes are positioned farther apart. Colored regions indicate sets of genes enriched for GO biological processes summarized by the indicated terms.
Fig. 2
Fig. 2
Magnification of the functional map better resolves cellular processes. (A) A subnetwork corresponding to a region of the global map described in Fig. 1 is indicated in red (inset). Node color corresponds to a specific biological process: dark green, amino acid biosynthesis and uptake; light green, signaling; light purple, ER-Golgi; dark purple, endosome and vacuole sorting; yellow, ER-dependent protein degradation; red, protein folding and glycosylation, cell wall biosynthesis and integrity; fuchsia, tRNA modification; pink, cell polarity and morphogenesis; orange, autophagy; and black, uncharacterized. Individual genetic interactions contributing to genetic profiles revealed by (A) are illustrated for three specific subnetworks in (B) to (D). (B to D) Subsets of genes belonging to amino acid biosynthesis and uptake, ER-Golgi, and tRNA modification regions of the network were selected, and, in some cases, additional genes were included from the complete network shown in Fig. 1. Nodes are grouped according to profile similarity, and edges represent negative (red) and positive (green) genetic interactions (|ε| > 0.08, P < 0.05). Nonessential (circles) and essential (diamonds) genes are colored according to the biological process indicated in (A), and uncharacterized genes are depicted in yellow. (E) PAR32, ECM30, and UBP15 are required for plasma membrane localization (micrographs) and activity (histogram) of the Gap1 amino acid permease. DIC, differential interference contrast; GFP, green fluorescent protein. (F) Sgt2 physically interacts with components of the GET pathway and members of the Hsp70 chaperone family. Proteins identified with high confidence as specific interactors for tandem affinity purification (TAP)–tagged Sgt2 (Sgt2-TAP) are shown in decreasing order of spectral counts. (G) Distribution of the Elp and Urm modified codon usage among synthetic sick or lethal interaction partners. The fraction of Elp and Urm modified codons (lysine, glutamine, and glutamic acid) relative to all codons was measured for all negative interactors with genes in the Elp or Urm complex (red) relative to the background usage of all genes (blue).
Fig. 3
Fig. 3
Positive and negative genetic interactions on the basis of a defined confidence threshold (|ε|> 0.08, P < 0.05) (7, 8). (A) The distribution of genetic interaction network degree for negative (red) and positive (green) interactions involving query genes. (B) The ratio of positive to negative interactions for each gene varies across the genome. (C) Pearson correlation between genetic interaction degree (derived from the array mutant strains) and physiological and evolutionary properties was measured for positive (green), negative (red) and protein-protein (black) interaction degree (7, 8). Chemical-genetic degree refers to the number of chemical perturbations to which a gene exhibits hypersensitivity. (Inset) The relation to gene multifunctionality for each of the interaction data sets is illustrated by measuring the average number of annotations to specific biological process GO terms for the top 1% highest degree genes for each interaction type. (7, 8).
Fig. 4
Fig. 4
(A) Frequency of synthetic lethal/sick (negative) genetic interactions within and across biological processes. The fraction of screened gene pairs exhibiting negative interactions was measured for 17 broadly defined functional gene sets (7, 8). A color was assigned to each process-process element reflecting the fraction of interaction (blue, below the frequency of random pairs; black, statistically indistinguishable from the random background of interactions; and yellow, above the frequency of random pairs), with the diagonal representing within-process interactions. The red line in the color scale bar indicates random background. (B) Genetic interaction frequency of duplicate genes. T bars, SEM. (C) Gene-specific factors explaining the variation in number of negative interactions across biological processes. (Top) The average number of interactions across each process with the color indicating processes that have more interactions than expected (yellow, P < 0.05); processes whose interaction degree is explained by the factors indicated on the y axis; and those with fewer interactions than expected (blue, P < 0.05). The influence of each gene-specific factor in explaining the number of interactions observed was measured by plotting the ratio of F statistics of the bioprocess factor before and after incorporating the additional gene-specific factor. This ratio is indicated by the corresponding column in the heat map (7, 8). (AA, amino acids; chrom. seg., chromosome segregation; HR, homologous recombination; kinetoch., kinetochore)
Fig. 5
Fig. 5
(A) A chemical-genetic interaction map is shown in which colored triangles represent chemical compounds and white nodes correspond to genes. Compounds were positioned on the map by highlighting the gene node whose genetic interaction profile most closely resembles the chemical genetic profile of the compound derived from three sources (7, 8). Compounds tightly correlated to genes positioned within functional clusters (Fig. 1) were colored accordingly to the color of the cluster as in Fig. 1. The chemical-genetic profile of hydroxyurea clustered with genes involved in DNA replication and repair, whereas that of erodoxin clustered with genes involved in protein folding, glycosylation, and cell wall biosynthesis. Compounds positioned outside functional clusters are colored light purple. (B) Network displaying overlap between ERO1 negative genetic interactions and genes resulting in growth inhibition when deleted in the presence of erodoxin. (C) ERO1-dependent pathway for oxidative protein-folding pathway. (D) Erodoxin inhibits Ero1-dependent oxidation of Trx1 in vitro. (E) Erodoxin inhibits CPY processing to the vacuolar form in vivo. ER (p1), Golgi (p2), and vacuolar (m) forms of CPY are indicated.

Comment in

  • Meaningful connections.
    Casci T. Casci T. Nat Rev Genet. 2010 Mar;11(3):172. doi: 10.1038/nrg2756. Nat Rev Genet. 2010. PMID: 21485431 No abstract available.

Similar articles

  • A global genetic interaction network maps a wiring diagram of cellular function.
    Costanzo M, VanderSluis B, Koch EN, Baryshnikova A, Pons C, Tan G, Wang W, Usaj M, Hanchard J, Lee SD, Pelechano V, Styles EB, Billmann M, van Leeuwen J, van Dyk N, Lin ZY, Kuzmin E, Nelson J, Piotrowski JS, Srikumar T, Bahr S, Chen Y, Deshpande R, Kurat CF, Li SC, Li Z, Usaj MM, Okada H, Pascoe N, San Luis BJ, Sharifpoor S, Shuteriqi E, Simpkins SW, Snider J, Suresh HG, Tan Y, Zhu H, Malod-Dognin N, Janjic V, Przulj N, Troyanskaya OG, Stagljar I, Xia T, Ohya Y, Gingras AC, Raught B, Boutros M, Steinmetz LM, Moore CL, Rosebrock AP, Caudy AA, Myers CL, Andrews B, Boone C. Costanzo M, et al. Science. 2016 Sep 23;353(6306):aaf1420. doi: 10.1126/science.aaf1420. Science. 2016. PMID: 27708008 Free PMC article.
  • Protein complexes are central in the yeast genetic landscape.
    Michaut M, Baryshnikova A, Costanzo M, Myers CL, Andrews BJ, Boone C, Bader GD. Michaut M, et al. PLoS Comput Biol. 2011 Feb;7(2):e1001092. doi: 10.1371/journal.pcbi.1001092. Epub 2011 Feb 24. PLoS Comput Biol. 2011. PMID: 21390331 Free PMC article.
  • An integrated approach to characterize genetic interaction networks in yeast metabolism.
    Szappanos B, Kovács K, Szamecz B, Honti F, Costanzo M, Baryshnikova A, Gelius-Dietrich G, Lercher MJ, Jelasity M, Myers CL, Andrews BJ, Boone C, Oliver SG, Pál C, Papp B. Szappanos B, et al. Nat Genet. 2011 May 29;43(7):656-62. doi: 10.1038/ng.846. Nat Genet. 2011. PMID: 21623372 Free PMC article.
  • Chemical-genetic approaches for exploring the mode of action of natural products.
    Lopez A, Parsons AB, Nislow C, Giaever G, Boone C. Lopez A, et al. Prog Drug Res. 2008;66:237, 239-71. doi: 10.1007/978-3-7643-8595-8_5. Prog Drug Res. 2008. PMID: 18416308 Review.
  • Integrating genetic and protein-protein interaction networks maps a functional wiring diagram of a cell.
    VanderSluis B, Costanzo M, Billmann M, Ward HN, Myers CL, Andrews BJ, Boone C. VanderSluis B, et al. Curr Opin Microbiol. 2018 Oct;45:170-179. doi: 10.1016/j.mib.2018.06.004. Epub 2018 Jul 28. Curr Opin Microbiol. 2018. PMID: 30059827 Free PMC article. Review.

Cited by

References

    1. Dixon SJ, Costanzo M, Baryshnikova A, Andrews B, Boone C. Annu Rev Genet. 2009;43:601. - PubMed
    1. Waddington CH. The Strategy of the Gene. Allen & Unwin; London: 1957.
    1. Hartwell L. Science. 2004;303:774. - PubMed
    1. Tong AH, et al. Science. 2001;294:2364. - PubMed
    1. Tong AH, et al. Science. 2004;303:808. - PubMed

Publication types

MeSH terms

Substances