. 2010 Jan;6(1):e1000805.
doi: 10.1371/journal.pgen.1000805. Epub 2010 Jan 8.

Alternative epigenetic chromatin states of polycomb target genes

Affiliations

Alternative epigenetic chromatin states of polycomb target genes

Yuri B Schwartz et al. PLoS Genet. 2010 Jan.

Abstract

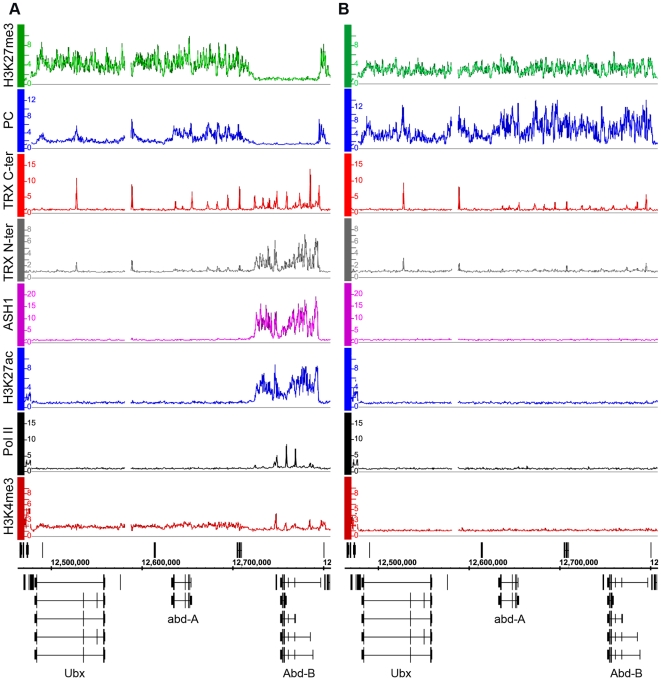
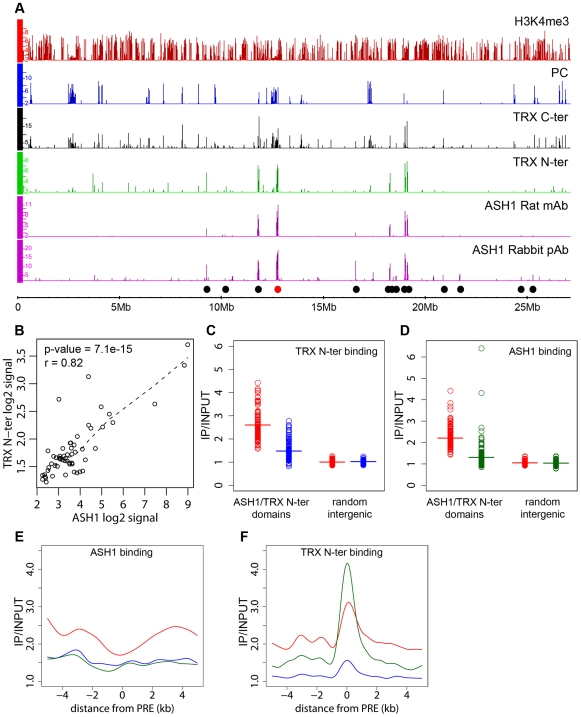
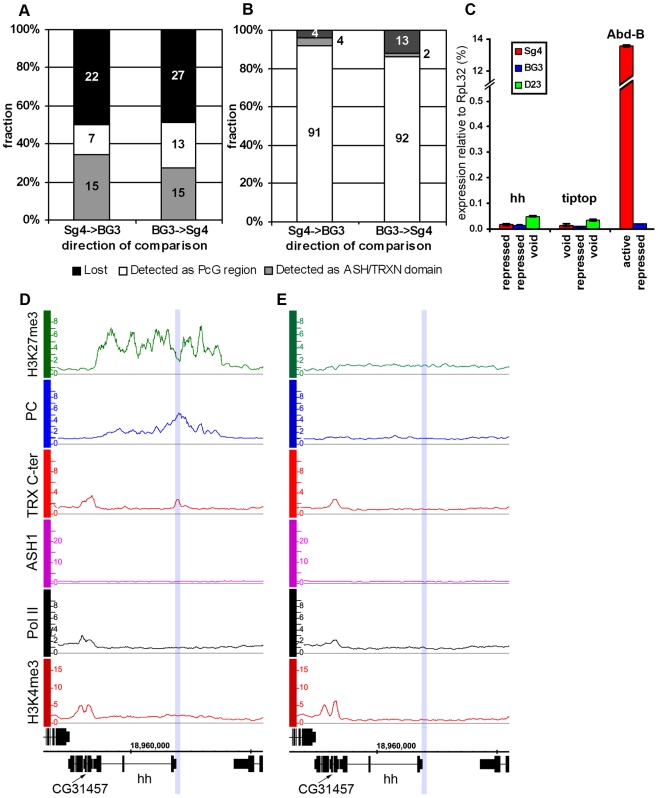
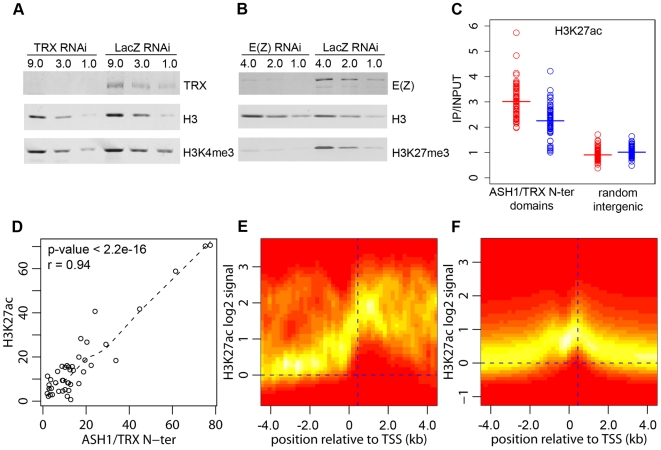
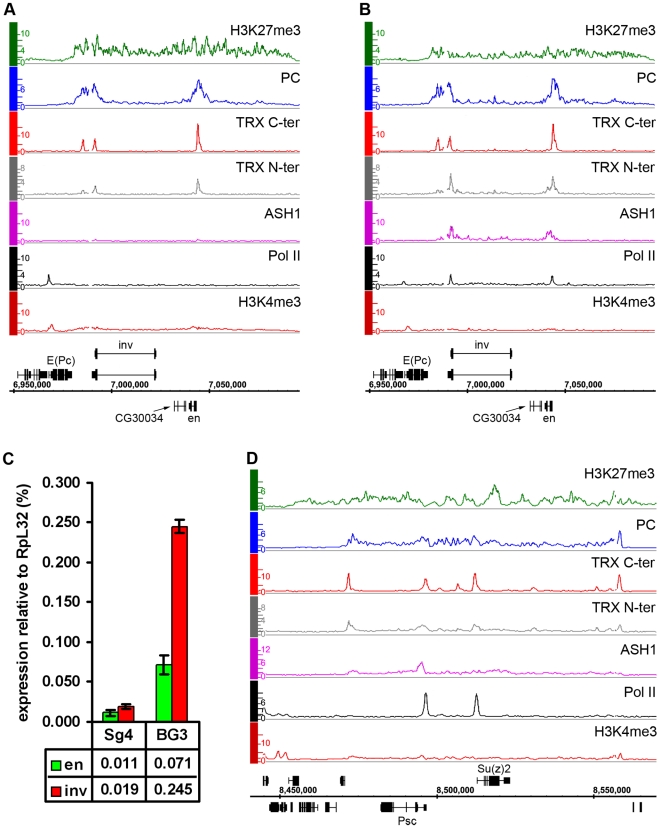
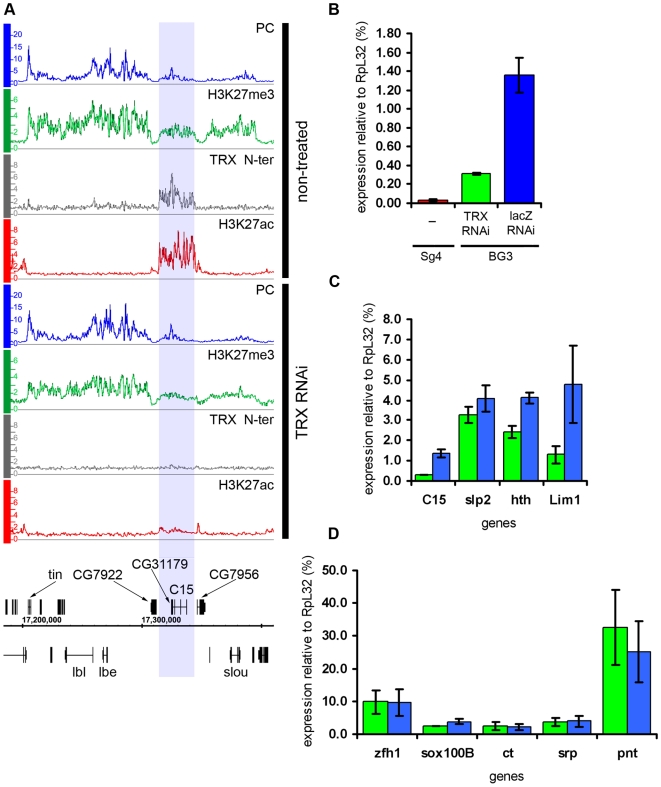
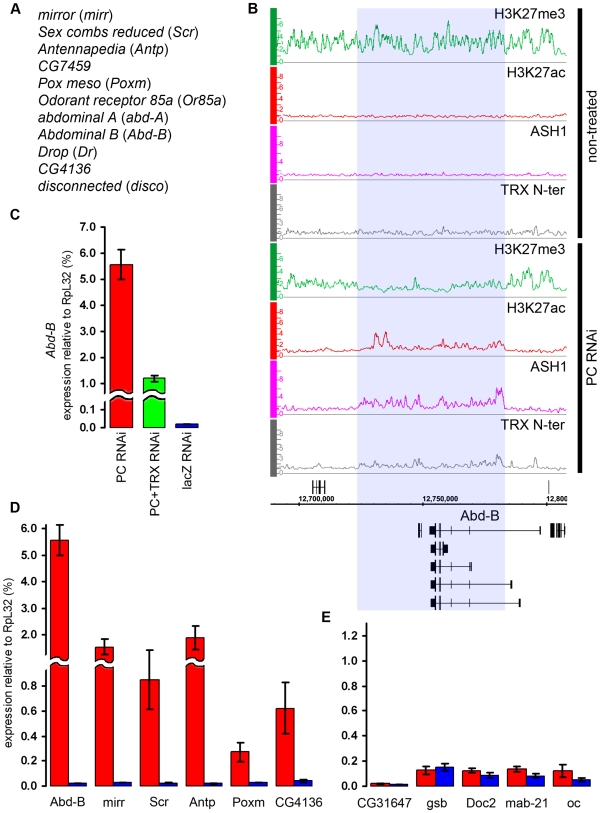
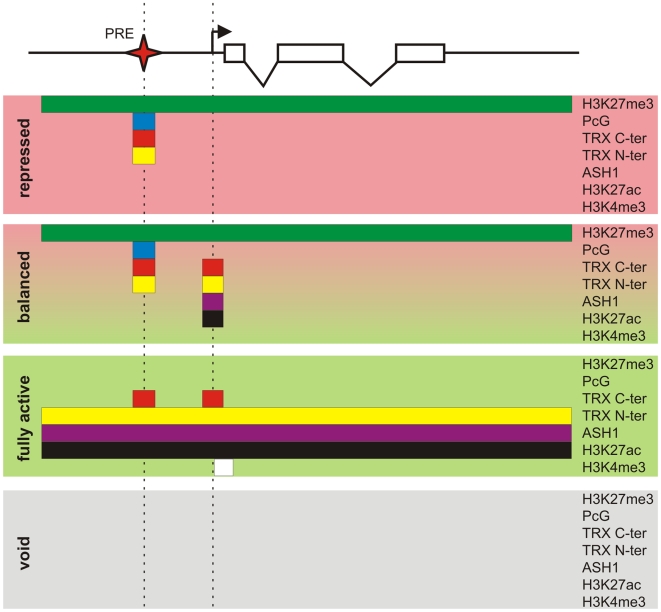
Polycomb (PcG) regulation has been thought to produce stable long-term gene silencing. Genomic analyses in Drosophila and mammals, however, have shown that it targets many genes, which can switch state during development. Genetic evidence indicates that critical for the active state of PcG target genes are the histone methyltransferases Trithorax (TRX) and ASH1. Here we analyze the repertoire of alternative states in which PcG target genes are found in different Drosophila cell lines and the role of PcG proteins TRX and ASH1 in controlling these states. Using extensive genome-wide chromatin immunoprecipitation analysis, RNAi knockdowns, and quantitative RT-PCR, we show that, in addition to the known repressed state, PcG targets can reside in a transcriptionally active state characterized by formation of an extended domain enriched in ASH1, the N-terminal, but not C-terminal moiety of TRX and H3K27ac. ASH1/TRX N-ter domains and transcription are not incompatible with repressive marks, sometimes resulting in a "balanced" state modulated by both repressors and activators. Often however, loss of PcG repression results instead in a "void" state, lacking transcription, H3K27ac, or binding of TRX or ASH1. We conclude that PcG repression is dynamic, not static, and that the propensity of a target gene to switch states depends on relative levels of PcG, TRX, and activators. N-ter TRX plays a remarkable role that antagonizes PcG repression and preempts H3K27 methylation by acetylation. This role is distinct from that usually attributed to TRX/MLL proteins at the promoter. These results have important implications for Polycomb gene regulation, the "bivalent" chromatin state of embryonic stem cells, and gene expression in development.


Conflict of interest statement

The authors have declared that no competing interests exist.

Figures

Figure 1
Figure 1. The Abd-B gene is repressed in BG3 cells and active in Sg4 cells.
The distributions of PcG, TrxG, ASH1, Pol II, and associated histone marks in the Bithorax Complex were mapped in (A) Sg4 and (B) BG3 cells. ChIP–chip results with antibodies indicated on the left of the graphs were expressed as smoothed ChIP/Input signal ratios averaged for two independent experiments. The positions and the exon structure of annotated transcripts are shown above (transcription left to right) and below (transcription right to left) the coordinate scale (in bp).
Figure 2
Figure 2. ASH1/TRX N-ter domains.
(A) Distributions of indicated proteins on chromosome 3R of Sg4 cells were plotted at 2-fold enrichment cutoff. Independent antibodies detect ASH1 at a small number of sites all of which also bind TRX. Only sites detected by both anti-ASH1 antibodies (black dots) were used for further analysis. The red dot marks the position of the Abd-B locus. Nearly all strong TRX binding sites that do not bind ASH1 correspond to repressed PC targets. Note that ASH1 or TRX bind to a small subset of active genes marked by H3K4me3. (B) The average enrichment of TRX N-ter was plotted against that of ASH1 for each ASH1 binding region in Sg4 cells. The dashed line shows the lowess fitting of the data. The Pearson product moment correlation test shows that the extent of binding of TRX N-ter and ASH1 is highly correlated. Comparison of average enrichment of TRX N-ter (C) and ASH1 (D) within bound regions in untreated BG3 cells (red) and BG3 cells treated with dsRNA against TRX (blue) or ASH1 (green) shows significant reduction of protein binding after RNAi. The background enrichment, assayed in 100 randomly selected intergenic regions, remains unchanged. Bars indicate the sample means. RNAi affects the distributions of ASH1 (E) or TRX N-ter (F). The plots show cubic spline fitting of superposed data from 10 kb windows centered at 19 computational PREs, within ASH1/TRX N-ter domains in BG3 cells before (red) or after TRX (blue) or ASH1 (green) RNAi. ASH1 shows no preferential binding to PREs and knock-down of ASH1 or TRX results in the uniform reduction of ASH1 binding throughout the domains. In contrast ASH1 knock-down removes TRX N-ter from the domains but not from the PREs.
Figure 3
Figure 3. The “void” chromatin state.
Changes of ASH1/TRX N-ter domains (A) and PcG target regions (B) between Sg4 and BG3 cells indicate the existence of the chromatin state devoid of both PcG and TrxG proteins. The y-axis shows the fraction of regions changed while their absolute numbers are indicated within bars. (C) The expression of hh, tiptop, and Abd-B loci in Sg4 (red), BG3 (blue), or D23 cells (green) was assayed by qRT–PCR. In this and following figures the histogram shows the mean of two independent experiments with error bars indicating the scatter. Comparison with Abd-B, which is active in Sg4 and repressed in BG3 cells, shows that in the “void” state hh and tiptop remain transcriptionally inactive. (D) The hedgehog (hh) gene is PcG-repressed in Sg4 cells, with PC and TRX bound at a previously identified PRE (blue shade), but is in the “void” state in D23 cells (E), with no PC nor H3K27me3 but also lacking TRX, ASH1, Pol II, and H3K4me3.
Figure 4
Figure 4. H3K27ac and ASH1/TRX N-ter domains.
(A) Effect of TRX or control LacZ RNAi knockdown on H3K4me3 compared to (B) the effect of E(Z) knockdown on H3K27me3. The western blots were probed with antibodies indicated on the right. (C) Average enrichment of H3K27ac within ASH1/TRX N-ter domains (circles) after TRX RNAi (blue) or control LacZ RNAi (red) compared to that in 100 randomly selected intergenic regions (squares). Bars indicate the sample means. (D) Scatter plot of lengths (in kb) of corresponding H3K27ac and ASH1/TRX N-ter binding regions. Dashed line shows the lowess fitting of the data. The Pearson product moment correlation test shows that ASH1/TRX N-ter domains are coextensive with H3K27ac. The TSS of active transcription units of genes with (E) or without ASH1/TRX N-ter domains (F) were defined based on Pol II and H3K4me3 binding. The log2-transformed H3K27ac/Input ratios from 10 kb windows centered on these TSS were superimposed into a single scatter plot. The color (red = zero, white = highest) indicates the density of observations. The plots show that H3K27ac is extensively distributed in ASH1/TRX N-ter domains but is confined to the region around position +450 (vertical dashed line) downstream of the TSS of active genes lacking ASH1. The weak peak of H3K27ac upstream of TSS is due to the frequency of closely juxtaposed divergently transcribed genes.
Figure 5
Figure 5. Examples of balanced chromatin state.
(A) The en-inv locus in Sg4 cells is repressed and silent, with TRX binding at three known PREs. (B) in BG3 cells both genes still bind PC and are H3K27 methylated but at the same time bind Pol II and ASH1 and produce ∼10 times more transcripts. (C) Results of qRT–PCR analysis of en and inv expression in Sg4 and BG3 cells. (D) The Psc-Su(z)2 locus shows profiles of H3K27me3 and PC over a broad domain yet it also binds RNA Pol II at the Psc and Su(z)2 promoters and localized peaks of TRX and ASH1, consistent with expression of both genes.
Figure 6
Figure 6. Effects of TRX knock-down.
(A) An example of exceptionally strong depletion of H3K27ac (blue shade) at the C15 locus after TRX RNAi. (B) qRT–PCR analysis indicates that the expression of C15 is reduced after TRX RNAi in BG3 cells, however, it remains 10 times higher then in Sg4 cells where the gene is fully repressed by PcG . (C) The expression of loci that show profound depletion of H3K27ac after TRX RNAi is slightly lower (green) than in mock-treated cells (blue). (D) TRX RNAi has no effect on the transcription of representative active PcG target genes.
Figure 7
Figure 7. The switching of chromatin state induced by PC RNAi.
(A) Genes that switch state from “repressed” to “balanced” after PC RNAi in BG3 cells. (B) The changes in the distribution of chromatin proteins and marks at the Abd-B locus after PC RNAi in BG3 cells. The affected region is marked by blue shade. (C) The expression of Abd-B after PC RNAi (red bar), double PC+TRX RNAi (green bar) or mock lacZ RNAi (blue bar) was assayed by qRT-PCR using primers that amplify the common part of the Abd-B transcripts. (D) Expression of representative genes from (A) assayed by qRT–PCR in cells subjected to PC RNAi (red bars) or mock lacZ RNAi (blue bars). (E) Expression of representative “repressed” genes under the same conditions as in (D).
Figure 8
Figure 8. Protein landscapes of alternative chromatin states.
A generic Polycomb target gene represented by a series of exons (open boxes) and introns (broken lines) can be found in four alternative epigenetic chromatin states. The “repressed” state is characterized by a broad domain of H3K27me3 whose extent is marked by the green bar. In this state the PcG proteins, whose distribution is indicated by the blue bar, and both TRX C-ter (red bar) and TRX N-ter (yellow bar) are bound at the PRE (red star). The action of certain combinations of repressors and activators leads to the “balanced” chromatin state. This state is characterized by the presence of repressive PcG marks and binding of TRX C-ter, TRX N-ter, ASH1 (purple bar), and H3K27ac around the TSS (broken arrow). Massive influx of activators switches a target gene to the “fully active” state. In this state the PcG proteins no longer bind to the PRE but TRX C-ter still associates with the PRE and also with the active TSS. The broad H3K27me3 domain is replaced by a domain of H3K27ac, TRX N-ter, and ASH1. The strong transcription of a target gene is accompanied by trimethylation of H3K4 downstream of the TSS (white bar). An unknown sequence of events results in the “void” chromatin state in which a target gene has lost PcG and TrxG regulation but remains transcriptionally inactive.

Similar articles

Cited by

References

    1. Schwartz YB, Pirrotta V. Polycomb silencing mechanisms and the management of genomic programmes. Nat Rev Genet. 2007;8:9–22. - PubMed
    1. Poux S, Horard B, Sigrist CJA, Pirrotta V. The Drosophila Trithorax protein is a coactivator required to prevent re-establishment of Polycomb silencing. Development. 2002;129:2483–2493. - PubMed
    1. Klymenko T, Müller J. The histone methyltransferases Trithorax and Ash1 prevent transcriptional silencing by Polycomb group proteins. EMBO Reports. 2004;5:373–377. - PMC - PubMed
    1. Smith ST, Petruk S, Sedkov Y, Cho E, Tillib S, et al. Modulation of heat shock gene expression by the TAC1 chromatin-modifying complex. Nat Cell Biol. 2004;6:162–167. - PubMed
    1. Miller T, Krogan NJ, Dover J, Erdjument-Bromage H, Tempst P, et al. COMPASS: a complex of proteins associated with a trithorax-related SET domain protein. Proc Natl Acad Sci USA. 2001;98:12902–12907. - PMC - PubMed

Publication types

MeSH terms

Associated data