

Pivotal advance: Kaposi's sarcoma-associated herpesvirus (KSHV)-encoded microRNA specifically induce IL-6 and IL-10 secretion by macrophages and monocytes
- PMID: 20052801
- PMCID: PMC2801620
- DOI: 10.1189/jlb.0409251
Pivotal advance: Kaposi's sarcoma-associated herpesvirus (KSHV)-encoded microRNA specifically induce IL-6 and IL-10 secretion by macrophages and monocytes
Abstract
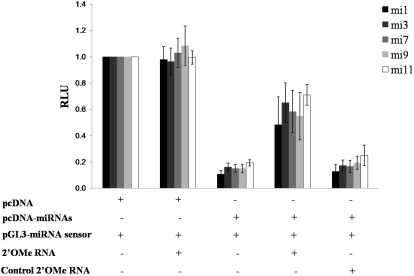
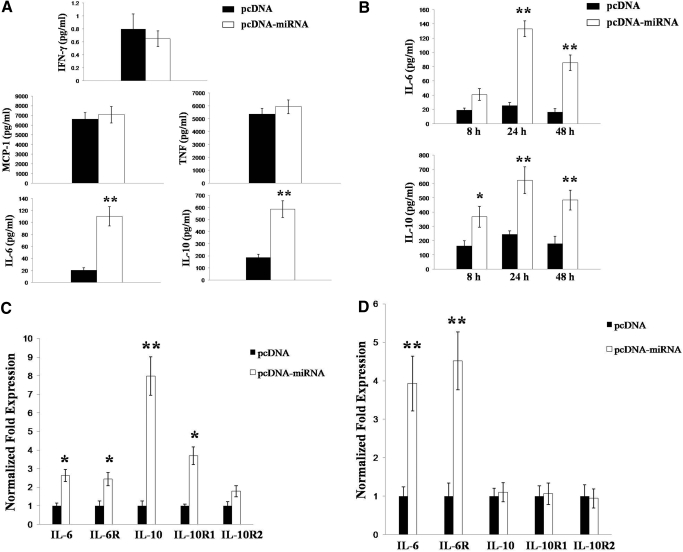
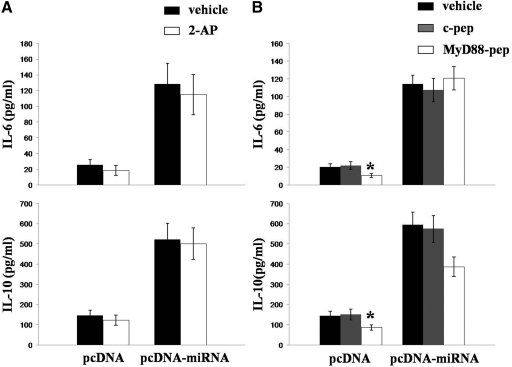
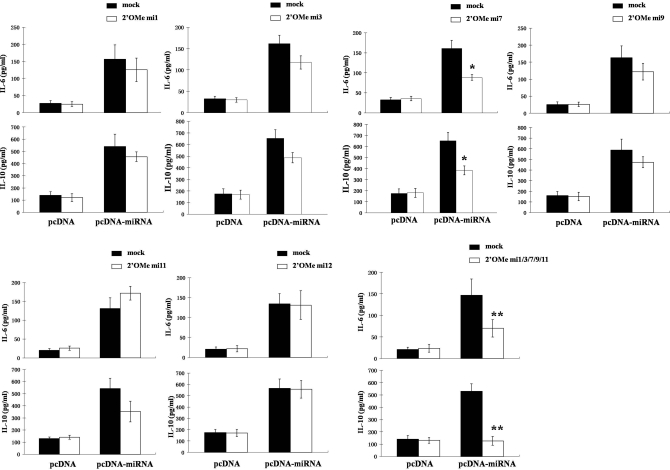
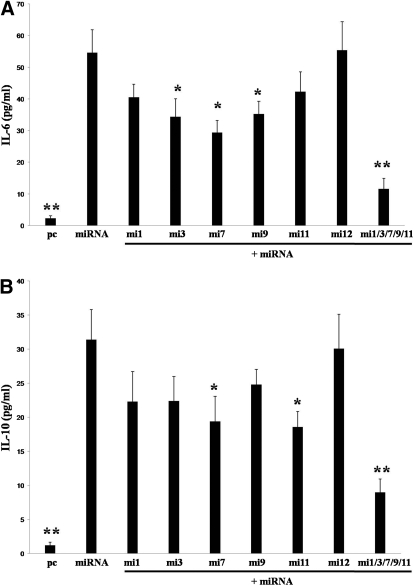
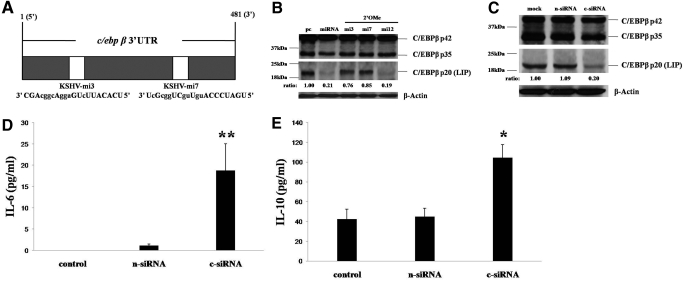
Macrophages are an important source of inflammatory cytokines generated during the innate immune response,but in the microenvironment of certain tumors,macrophages promote tumor progression through their preferential secretion of cytokines that support tumor cell growth and suppress antitumoral immune responses. KSHV is the causative agent of KS and lymphomas preferentially arising in immuno compromised patients, and specific cytokines, including IL-6 and IL-10, have been implicated in KSHV-associated cancer pathogenesis. However, the contribution of KSHV-infected macrophages to the cytokine milieu within KSHV-related tumors is unclear. We found that individual KSHV-encoded miRNA induce IL-6 and IL-10 secretion independently and additively by murine macrophages and human myelomonocytic cells. Bioinformatics analysis identified KSHV miRNA binding sites formiR-K12-3 and miR-K12-7 within the 3'UTR of the basic region/leucine zipper motif transcription factor C/EBPbeta, a known regulator of IL-6 and IL-10 transcriptional activation.Subsequent immunoblot analyses revealed that miR-K12-3 and miR-K12-7 preferentially reduce expression of C/EBPbeta p20 (LIP), an isoform of C/EBPbeta known to function as a negative transcription regulator. In addition,RNA interference specifically targeting LIP induced basal secretion of IL-6 and IL-10 by macrophages.Taken together, these data support a role for KSHV miRNA in the programming of macrophage cytokine responses in favor of KSHV-related tumor progression.
Figures

Comment in
-
Editorial: quality versus quantity in myeloid infection by a herpesvirus: more than one way to skin the CCAAT?J Leukoc Biol. 2010 Jan;87(1):9-12. doi: 10.1189/jlb.0809534. J Leukoc Biol. 2010. PMID: 20047884 Free PMC article. No abstract available.
Similar articles
-
Editorial: quality versus quantity in myeloid infection by a herpesvirus: more than one way to skin the CCAAT?J Leukoc Biol. 2010 Jan;87(1):9-12. doi: 10.1189/jlb.0809534. J Leukoc Biol. 2010. PMID: 20047884 Free PMC article. No abstract available.
-
Kaposi's Sarcoma-Associated Herpesvirus Increases PD-L1 and Proinflammatory Cytokine Expression in Human Monocytes.mBio. 2017 Oct 10;8(5):e00917-17. doi: 10.1128/mBio.00917-17. mBio. 2017. PMID: 29018115 Free PMC article.
-
Kaposi's sarcoma herpesvirus (KSHV) microRNA K12-1 functions as an oncogene by activating NF-κB/IL-6/STAT3 signaling.Oncotarget. 2016 May 31;7(22):33363-73. doi: 10.18632/oncotarget.9221. Oncotarget. 2016. PMID: 27166260 Free PMC article.
-
KSHV microRNAs: Tricks of the Devil.Trends Microbiol. 2017 Aug;25(8):648-661. doi: 10.1016/j.tim.2017.02.002. Epub 2017 Mar 2. Trends Microbiol. 2017. PMID: 28259385 Free PMC article. Review.
-
KSHV miRNAs decrease expression of lytic genes in latently infected PEL and endothelial cells by targeting host transcription factors.Viruses. 2014 Oct 23;6(10):4005-23. doi: 10.3390/v6104005. Viruses. 2014. PMID: 25341664 Free PMC article. Review.
Cited by
-
Recent advances in Kaposi sarcoma herpesvirus-associated multicentric Castleman disease.Curr Opin Oncol. 2012 Sep;24(5):495-505. doi: 10.1097/CCO.0b013e328355e0f3. Curr Opin Oncol. 2012. PMID: 22729151 Free PMC article. Review.
-
Viral miRNA targeting of bicistronic and polycistronic transcripts.Curr Opin Virol. 2014 Aug;7:66-72. doi: 10.1016/j.coviro.2014.04.004. Epub 2014 May 10. Curr Opin Virol. 2014. PMID: 24821460 Free PMC article. Review.
-
Host RAB11FIP5 protein inhibits the release of Kaposi's sarcoma-associated herpesvirus particles by promoting lysosomal degradation of ORF45.PLoS Pathog. 2020 Dec 14;16(12):e1009099. doi: 10.1371/journal.ppat.1009099. eCollection 2020 Dec. PLoS Pathog. 2020. PMID: 33315947 Free PMC article.
-
Diverse mechanisms evolved by DNA viruses to inhibit early host defenses.Crit Rev Biochem Mol Biol. 2016 Nov/Dec;51(6):452-481. doi: 10.1080/10409238.2016.1226250. Epub 2016 Sep 21. Crit Rev Biochem Mol Biol. 2016. PMID: 27650455 Free PMC article. Review.
-
Proteomics of Bronchoalveolar Lavage Fluid Reveals a Lung Oxidative Stress Response in Murine Herpesvirus-68 Infection.Viruses. 2018 Nov 27;10(12):670. doi: 10.3390/v10120670. Viruses. 2018. PMID: 30486363 Free PMC article.
References
-
- Cesarman E, Chang Y, Moore P S, Said J W, Knowles D M. Kaposi’s sarcoma-associated herpesvirus-like DNA sequences in AIDS-related body-cavity-based lymphomas. N Engl J Med. 1995;332:1186–1191. - PubMed
-
- Soulier J, Grollet L, Oksenhendler E, Cacoub P, Cazals-Hatem D, Babinet P, d'Agay M F, Clauvel J P, Raphael M, Degos L. Kaposi’s sarcoma-associated herpesvirus-like DNA sequences in multicentric Castleman’s disease. Blood. 1995;86:1276–1280. - PubMed
-
- Engels E A, Biggar R J, Hall H I, Cross H, Crutchfield A, Finch J L, Grigg R, Hylton T, Pawlish K S, McNeel T S, Goedert J J. Cancer risk in people infected with human immunodeficiency virus in the United States. Int J Cancer. 2008;123:187–194. - PubMed
-
- Bonnet F, Lewden C, May T, Heripret L, Jougla E, Bevilacqua S, Costagliola D, Salmon D, Chene G, Morlat P. Malignancy-related causes of death in human immunodeficiency virus-infected patients in the era of highly active antiretroviral therapy. Cancer. 2004;101:317–324. - PubMed
-
- Jones K D, Aoki Y, Chang Y, Moore P S, Yarchoan R, Tosato G. Involvement of interleukin-10 (IL-10) and viral IL-6 in the spontaneous growth of Kaposi’s sarcoma herpesvirus-associated infected primary effusion lymphoma cells. Blood. 1999;94:2871–2879. - PubMed
Publication types
MeSH terms
Substances
Grants and funding
LinkOut - more resources
Full Text Sources
