Muscle cells enhance resistance to pro-inflammatory cytokine-induced cartilage destruction
- PMID: 20043873
- PMCID: PMC2841304
- DOI: 10.1016/j.bbrc.2009.12.138
Muscle cells enhance resistance to pro-inflammatory cytokine-induced cartilage destruction
Abstract
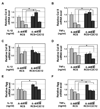
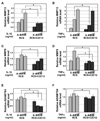
Pro-inflammatory cytokines IL-1beta and TNFalpha play important roles in the manifestation of arthritis by disrupting the anabolic and catabolic activities of the chondrocytes. We observed a novel mechanism of cartilage regulation by which muscle cells diminish the response of chondrocytes to IL-1beta and TNFalpha. We found that chondrocytes cocultured with muscle cells or cultured in muscle cell-conditioned medium significantly enhanced the expression of cartilage matrix proteins (collagen II and collagen IX) and resisted IL-1beta and TNFalpha-induced cartilage damage. Our data suggest that this effect is achieved by inhibiting the expression of key components of the signaling pathways of pro-inflammatory cytokines (including NFkappaB, ESE-1, Cox-2, and GADD45beta), leading to attenuated expression of cartilage-degrading enzymes (MMPs and ADAMTS4). Therefore, our work unveils a potential role of muscle in regulating cartilage homeostasis and response to pro-inflammatory stimuli, and provides insights on designing treatment strategies for joint degenerative diseases such as arthritis.
Copyright (c) 2009 Elsevier Inc. All rights reserved.
Figures


Similar articles
-
Cyclin-dependent kinase 9 inhibition protects cartilage from the catabolic effects of proinflammatory cytokines.Arthritis Rheumatol. 2014 Jun;66(6):1537-46. doi: 10.1002/art.38378. Arthritis Rheumatol. 2014. PMID: 24470357 Free PMC article.
-
Effect of Phellodendron amurense in protecting human osteoarthritic cartilage and chondrocytes.J Ethnopharmacol. 2011 Mar 24;134(2):234-42. doi: 10.1016/j.jep.2010.12.005. Epub 2010 Dec 21. J Ethnopharmacol. 2011. PMID: 21182922
-
Arthropod steroid hormone (20-Hydroxyecdysone) suppresses IL-1β-induced catabolic gene expression in cartilage.BMC Complement Altern Med. 2015 Jan 24;15:1. doi: 10.1186/s12906-015-0520-z. BMC Complement Altern Med. 2015. PMID: 25617057 Free PMC article.
-
Ghrelin prevents articular cartilage matrix destruction in human chondrocytes.Biomed Pharmacother. 2018 Feb;98:651-655. doi: 10.1016/j.biopha.2017.12.050. Epub 2018 Jan 4. Biomed Pharmacother. 2018. PMID: 29291551 Review.
-
Molecular aspects of pathogenesis in osteoarthritis: the role of inflammation.Cell Mol Life Sci. 2002 Jan;59(1):45-53. doi: 10.1007/s00018-002-8404-z. Cell Mol Life Sci. 2002. PMID: 11846032 Free PMC article. Review.
Cited by
-
Psychological stress alters the ultrastructure and increases IL-1β and TNF-α in mandibular condylar cartilage.Braz J Med Biol Res. 2012 Oct;45(10):968-76. doi: 10.1590/s0100-879x2012007500102. Epub 2012 Jun 21. Braz J Med Biol Res. 2012. PMID: 22714807 Free PMC article.
-
Integrating transcriptome-wide association study and mRNA expression profile identified candidate genes related to hand osteoarthritis.Arthritis Res Ther. 2021 Mar 10;23(1):81. doi: 10.1186/s13075-021-02458-2. Arthritis Res Ther. 2021. PMID: 33691763 Free PMC article.
-
Sex differences in the radiographic and symptomatic prevalence of knee and hip osteoarthritis.Front Endocrinol (Lausanne). 2024 Oct 4;15:1445468. doi: 10.3389/fendo.2024.1445468. eCollection 2024. Front Endocrinol (Lausanne). 2024. PMID: 39429735 Free PMC article. Review.
-
Muscle cell-derived factors inhibit inflammatory stimuli-induced damage in hMSC-derived chondrocytes.Osteoarthritis Cartilage. 2013 Jul;21(7):990-8. doi: 10.1016/j.joca.2013.04.011. Epub 2013 Apr 20. Osteoarthritis Cartilage. 2013. PMID: 23611899 Free PMC article.
-
The Chondroprotective Role of Erythromycin in a Murine Joint Destruction Model.Cartilage. 2016 Oct;7(4):373-87. doi: 10.1177/1947603516630787. Epub 2016 Feb 17. Cartilage. 2016. PMID: 27688845 Free PMC article.
References
-
- Blaschke UK, Eikenberry EF, Hulmes DJ, et al. Collagen XI nucleates self-assembly and limits lateral growth of cartilage fibrils. J Biol Chem. 2000;275:10370–10378. - PubMed
Publication types
MeSH terms
Substances
Grants and funding
LinkOut - more resources
Full Text Sources
Medical
Research Materials

