Quantitative analysis of three-dimensional human mammary epithelial tissue architecture reveals a role for tenascin-C in regulating c-met function
- PMID: 20042668
- PMCID: PMC2808088
- DOI: 10.2353/ajpath.2010.090006
Quantitative analysis of three-dimensional human mammary epithelial tissue architecture reveals a role for tenascin-C in regulating c-met function
Abstract
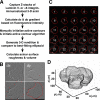
Remodeling of the stromal extracellular matrix and elevated expression of specific proto-oncogenes within the adjacent epithelium represent cardinal features of breast cancer, yet how these events become integrated is not fully understood. To address this question, we focused on tenascin-C (TN-C), a stromal extracellular matrix glycoprotein whose expression increases with disease severity. Initially, nonmalignant human mammary epithelial cells (MCF-10A) were cultured within a reconstituted basement membrane (BM) where they formed three-dimensional (3-D) polarized, growth-attenuated, multicellular acini, enveloped by a continuous endogenous BM. In the presence of TN-C, however, acini failed to generate a normal BM, and net epithelial cell proliferation increased. To quantify how TN-C alters 3-D tissue architecture and function, we developed a computational image analysis algorithm, which showed that although TN-C disrupted acinar surface structure, it had no effect on their volume. Thus, TN-C promoted epithelial cell proliferation leading to luminal filling, a process that we hypothesized involved c-met, a proto-oncogene amplified in breast tumors that promotes intraluminal filling. Indeed, TN-C increased epithelial c-met expression and promoted luminal filling, whereas blockade of c-met function reversed this phenotype, resulting in normal BM deposition, proper lumen formation, and decreased cell proliferation. Collectively, these studies, combining a novel quantitative image analysis tool with 3-D organotypic cultures, demonstrate that stromal changes associated with breast cancer can control proto-oncogene function.
Figures


Similar articles
-
Ectopic runx2 expression in mammary epithelial cells disrupts formation of normal acini structure: implications for breast cancer progression.Cancer Res. 2009 Sep 1;69(17):6807-14. doi: 10.1158/0008-5472.CAN-09-1471. Epub 2009 Aug 18. Cancer Res. 2009. PMID: 19690135 Free PMC article.
-
BAG-1 overexpression attenuates luminal apoptosis in MCF-10A mammary epithelial cells through enhanced RAF-1 activation.Oncogene. 2010 Jan 28;29(4):527-38. doi: 10.1038/onc.2009.362. Epub 2009 Nov 2. Oncogene. 2010. PMID: 19881545
-
Bim regulation of lumen formation in cultured mammary epithelial acini is targeted by oncogenes.Mol Cell Biol. 2005 Jun;25(11):4591-601. doi: 10.1128/MCB.25.11.4591-4601.2005. Mol Cell Biol. 2005. PMID: 15899862 Free PMC article.
-
Tenascin-C in development and disease: gene regulation and cell function.Matrix Biol. 2000 Dec;19(7):581-96. doi: 10.1016/s0945-053x(00)00106-2. Matrix Biol. 2000. PMID: 11102748 Review.
-
Use of three-dimensional basement membrane cultures to model oncogene-induced changes in mammary epithelial morphogenesis.J Mammary Gland Biol Neoplasia. 2004 Oct;9(4):297-310. doi: 10.1007/s10911-004-1402-z. J Mammary Gland Biol Neoplasia. 2004. PMID: 15838601 Free PMC article. Review.
Cited by
-
The role of cancer-associated myofibroblasts in intrahepatic cholangiocarcinoma.Nat Rev Gastroenterol Hepatol. 2011 Nov 29;9(1):44-54. doi: 10.1038/nrgastro.2011.222. Nat Rev Gastroenterol Hepatol. 2011. PMID: 22143274 Review.
-
Progressive polarity loss and luminal collapse disrupt tissue organization in carcinoma.Genes Dev. 2017 Aug 1;31(15):1573-1587. doi: 10.1101/gad.300566.117. Epub 2017 Sep 8. Genes Dev. 2017. PMID: 28887414 Free PMC article.
-
The cJUN NH2-terminal kinase (JNK) signaling pathway promotes genome stability and prevents tumor initiation.Elife. 2018 Jun 1;7:e36389. doi: 10.7554/eLife.36389. Elife. 2018. PMID: 29856313 Free PMC article.
-
Microsomal prostaglandin e2 synthase-1 modulates the response to vascular injury.Circulation. 2011 Feb 15;123(6):631-9. doi: 10.1161/CIRCULATIONAHA.110.973685. Epub 2011 Jan 31. Circulation. 2011. PMID: 21282500 Free PMC article.
-
Advances in tenascin-C biology.Cell Mol Life Sci. 2011 Oct;68(19):3175-99. doi: 10.1007/s00018-011-0783-6. Epub 2011 Aug 5. Cell Mol Life Sci. 2011. PMID: 21818551 Free PMC article. Review.
References
-
- Hanahan D, Weinberg RA. The hallmarks of cancer. Cell. 2000;100:57–70. - PubMed
-
- Paszek MJ, Zahir N, Johnson KR, Lakins JN, Rozenberg GI, Gefen A, Reinhart-King CA, Margulies SS, Dembo M, Boettiger D, Hammer DA, Weaver VM. Tensional homeostasis and the malignant phenotype. Cancer Cell. 2005;8:241–254. - PubMed
-
- Schedin P, Mitrenga T, McDaniel S, Kaeck M. Mammary ECM composition and function are altered by reproductive state. Mol Carcinog. 2004;41:207–220. - PubMed
-
- Aggeler J, Ward J, Blackie LM, Barcellos-Hoff MH, Streuli CH, Bissell MJ. Cytodifferentiation of mouse mammary epithelial cells cultured on a reconstituted basement membrane reveals striking similarities to development in vivo, J Cell Sci. 1991;99 (Pt 2):407–417. - PubMed
Publication types
MeSH terms
Substances
LinkOut - more resources
Full Text Sources
Miscellaneous

