. 2010 Feb 25;115(8):1582-93.
doi: 10.1182/blood-2009-10-246116. Epub 2009 Dec 28.

Perforin activates clathrin- and dynamin-dependent endocytosis, which is required for plasma membrane repair and delivery of granzyme B for granzyme-mediated apoptosis

Affiliations

Perforin activates clathrin- and dynamin-dependent endocytosis, which is required for plasma membrane repair and delivery of granzyme B for granzyme-mediated apoptosis

Jerome Thiery et al. Blood. .

Abstract

Cytotoxic T lymphocytes and natural killer cells destroy target cells via the polarized exocytosis of lytic effector proteins, perforin and granzymes, into the immunologic synapse. How these molecules enter target cells is not fully understood. It is debated whether granzymes enter via perforin pores formed at the plasma membrane or whether perforin and granzymes are first endocytosed and granzymes are then released from endosomes into the cytoplasm. We previously showed that perforin disruption of the plasma membrane induces a transient Ca(2+) flux into the target cell that triggers a wounded membrane repair response in which lysosomes and endosomes donate their membranes to reseal the damaged membrane. Here we show that perforin activates clathrin- and dynamin-dependent endocytosis, which removes perforin and granzymes from the plasma membrane to early endosomes, preserving outer membrane integrity. Inhibiting clathrin- or dynamin-dependent endocytosis shifts death by perforin and granzyme B from apoptosis to necrosis. Thus by activating endocytosis to preserve membrane integrity, perforin facilitates granzyme uptake and avoids the proinflammatory necrotic death of a membrane-damaged cell.


Figures
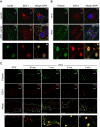
Figure 1
Figure 1
PFN and GzmB are rapidly endocytosed into EEA-1+ outsized early endosomes. (A-B) Within 5 minutes of treatment with sublytic native hPFN and hGzmB, large intracellular and membrane bound endosomes (gigantosomes) coimmunostain for GzmB (A) or PFN (B) and the early endosomal marker EEA-1. Images were acquired by wide-field fluorescence microscopy and deconvolved using iterative deconvolution. Representative Z stack series projections from 3 independent experiments are shown. Percentage of cells with GzmB or PFN staining enlarged endosomes is indicated (mean ± SD). (C) HeLa cells were exposed to sublytic hPFN for indicated times and stained for PFN and EEA-1. PFN is first detected at the plasma membrane and then endocytosed into EEA-1+ endosomes before forming gigantosomes. Representative confocal sections from 3 independent experiments are shown. PFN or GzmB was detected using AlexaFluor 488–conjugated secondary antibody and EEA-1 using AlexaFluor 647–conjugated secondary antibody. Color bars and associated numbers indicate fluorescence intensity levels. Scale bars represent 10 μm. Dashed lines indicate plasma membrane. Magnification and other image acquisition data are in supplemental Methods.
Figure 2
Figure 2
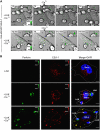
Large endosomes (gigantosomes) form in target cells within minutes of triggering CTL degranulation. (A) Large EEA-1+ endosomes form in a target cell after CTL degranulation. EGFP–EEA-1–transfected HeLa target cells were incubated with specific CTLs in the presence of EGTA to allow conjugate formation. After 2 minutes, CaCl2 was added to induce CTL degranulation (bottom; images from supplemental Videos 1-2). Enlarged endosomes form in the target cell within minutes after CTL degranulation, although the size of early endosomes does not change in the absence of calcium (top). Data (deconvolved wide-field images) are representative of 3 independent experiments. (B) Large endosomes formed in target cells after CTL attack contain PFN. Concanavalin A–coated HeLa cells were incubated with LAK cells in the presence of EGTA to allow conjugate formation, and then buffer (top) or CaCl2 (bottom) was added to induce cytotoxic granule exocytosis 5 minutes before fixation. Data depicted (deconvolved wide-field 3-dimensional images followed by Z projection) are representative of 2 independent experiments. PFN signal was detected using AlexaFluor 488–conjugated secondary antibody and EEA-1 using AlexaFluor 647–conjugated secondary antibody. Color bars and associated numbers indicate fluorescence intensity levels. Scale bars represent 10 μm. Dashed lines indicate plasma membrane.
Figure 3
Figure 3
Gigantosomes are coated with clathrin. HeLa cells stably expressing EGFP-CLC (green) and transfected with mRFP–EEA-1 (red) were analyzed by live 3-dimensional confocal capture 10 minutes after sublytic rPFN treatment. In the presence of rPFN, gigantosomes stained with EEA-1 (red), colocalize with clathrin (green) as indicated. One representative optical section obtained from sequential 0.1-μm optical sections (supplemental Videos 3-4) is shown for each condition. Most of the gigantosomes (red) are coated with clathrin (green). Data are representative of 5 independent experiments. Color bars and associated numbers indicate fluorescence intensity levels. Scale bars represent 10 μm. Dashed lines indicate plasma membrane.
Figure 4
Figure 4
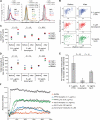
Perforin increases clathrin-mediated endocytosis. (A) Within 7 minutes of treatment, sublytic rPFN and SLO activate uptake of A488-GzmB, whereas ionomycin, even at the highest lytic concentration, does not. Mean fluorescence intensity (mean ± SD) from 3 independent experiments is indicated. (B) rPFN and SLO increase the rate of AP-2–dependent endocytosis, but ionomycin does not. HeLa cells stably expressing EGFP–AP-2σ2 were used for spatial and temporal analysis of AP-2 at CCPs. Cells were imaged every 10 seconds by spinning disk confocal microscopy before and after addition of sublytic rPFN, ionomycin, or SLO. The maximum fluorescence intensity and lifetime of new membrane-associated AP-2 spots were measured 400 seconds before and after treatment. Representative data from one cell treated with rPFN, ionomycin, or SLO (supplemental Videos 3-5) are shown. (C-D) Sublytic rPFN and SLO significantly increase the number of new AP-2 spots associated with the plasma membrane and the total intensity of membrane-associated AP-2 molecules, whereas ionomycin (5μM) only slightly increases membrane-associated AP-2. Data depicted were obtained from 3 different cells and 3 independent experiments. Data depicted in panel B correspond to cell no. 3 for each treatment. (E) The percentage increase of AP-2–mediated endocytosis after treatment (mean ± SD) was calculated. (F) Intracellular Ca2+ increases after sublytic rPFN, SLO, and ionomycin treatment. Calcium influx was measured by FlexStation III (Molecular Devices) in HeLa cells stained with Fura-2/AM at 5-second intervals after adding PFN, SLO, or ionomycin. At sublytic concentrations, rPFN and SLO induce a transient Ca2+ flux, whereas ionomycin induces a sustained and global rise of intracellular Ca2+. Data are representative of 3 independent experiments.
Figure 5
Figure 5
Inhibiting clathrin-mediated endocytosis increases PFN-induced necrosis. Inhibition of Dyn/clathrin-dependent endocytosis increases necrotic cell death after sublytic rPFN treatment. HeLa cells were transfected with siRNAs for Dyn2, AP-2μ2, and CHC or pretreated with Dynasore (80μM), an inhibitor of Dyn GTPase function, and then incubated for 15 minutes with sublytic rPFN. GFP (ctrl) or Flotillin-1 siRNAs were used as negative controls. Necrosis was evaluated immediately by flow cytometric measurement of PI uptake. Representative histograms after sublytic rPFN treatment (A), and mean ± SD from 3 independent experiments with sublytic (B) or different doses of rPFN (C) are shown. *P < .03, #P < .001, relative to control siRNA–treated cells.
Figure 6
Figure 6
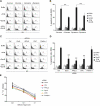
Clathrin-mediated endocytosis is required for PFN-mediated GzmB internalization. (A-B) Inhibition of Dyn/clathrin-mediated endocytosis by pretreatment with hypertonic sucrose (300mM) or Dynasore (80μM) decreases sublytic rPFN-induced A488-GzmB internalization. (C) Cells transfected with Dyn2, AP-2μ2, or CHC siRNAs show reduced GzmB internalization, compared with control cells treated with GFP (ctrl) or Flotillin-1 siRNAs, 5 minutes after incubation with sublytic rPFN and A488-GzmB. Graphs are representative of 3 independent experiments and mean fluorescence intensity (MFI; mean ± SD) is indicated. (D) Concentration of A488-GzmB (green) in the nucleus of target cells 20 minutes after sublytic rPFN, and A488-GzmB incubation is seen in cells treated with flotillin-1 or GFP (Ctrl) siRNAs but not in cells treated with CHC siRNA. Numbers indicate the percentage of cells with nuclear GzmB (mean ± SD from 3 independent experiments). GzmB signal was detected using AlexaFluor 488–conjugated secondary antibody and EEA-1, using AlexaFluor 647–conjugated secondary antibody. Color bars and associated numbers indicate fluorescence intensity levels. Dashed lines indicate nuclei. Scale bar represents 10 μm.
Figure 7
Figure 7
Inhibition of clathrin-mediated endocytosis reduces PFN- and GzmB-mediated apoptosis, but does not alter the extent of CTL-mediated death. (A-B) Chemical inhibitors of clathrin-mediated endocytosis decrease PFN- and GzmB-induced apoptosis. HeLa cells were preincubated with or without hypertonic sucrose or Dynasore before treatment with buffer or sublytic rPFN and/or GzmB. Apoptosis was measured 2 hours later by caspase activation by labeling with M30 monoclonal antibody. Representative flow cytometric histogram (A) and mean ± SD from 3 independent experiments (B) are depicted. **P < .005 relative to control siRNA–treated cells. (C-D) Specific inhibition of Dyn/clathrin-mediated endocytosis with siRNAs decreases PFN- and GzmB-induced apoptosis. HeLa cells were transfected with indicated siRNAs before treatment with rPFN and/or GzmB and apoptosis was measured as in panels A and B. Representative flow cytometric histogram (C) and mean ± SD from 3 independent experiments (D) are shown. **P < .005 relative to control siRNA–transfected cells. (E) Inhibition of Dyn/clathrin-mediated endocytosis does not interfere with overall CTL-induced cell death evaluated by 51Cr release assay. HeLa cells transfected with indicated siRNAs were incubated for 4 hours with specific CTLs. The data (mean ± SD) were obtained from 2 independent experiments performed in triplicate.

Similar articles

Cited by

References

    1. Stinchcombe JC, Bossi G, Booth S, Griffiths GM. The immunological synapse of CTL contains a secretory domain and membrane bridges. Immunity. 2001;15(5):751–761. - PubMed
    1. Chowdhury D, Lieberman J. Death by a thousand cuts: granzyme pathways of programmed cell death. Annu Rev Immunol. 2008;26:389–420. - PMC - PubMed
    1. Masson D, Tschopp J. Isolation of a lytic, pore-forming protein (perforin) from cytolytic T-lymphocytes. J Biol Chem. 1985;260(16):9069–9072. - PubMed
    1. Podack ER, Young JD, Cohn ZA. Isolation and biochemical and functional characterization of perforin 1 from cytolytic T-cell granules. Proc Natl Acad Sci U S A. 1985;82(24):8629–8633. - PMC - PubMed
    1. Kagi D, Ledermann B, Burki K, et al. Cytotoxicity mediated by T cells and natural killer cells is greatly impaired in perforin-deficient mice. Nature. 1994;369(6475):31–37. - PubMed

Publication types

MeSH terms