. 2010 Apr;38(6):1932-49.
doi: 10.1093/nar/gkp1169. Epub 2009 Dec 23.

Epstein-Barr virus DNase (BGLF5) induces genomic instability in human epithelial cells

Affiliations

Epstein-Barr virus DNase (BGLF5) induces genomic instability in human epithelial cells

Chung-Chun Wu et al. Nucleic Acids Res. 2010 Apr.

Abstract

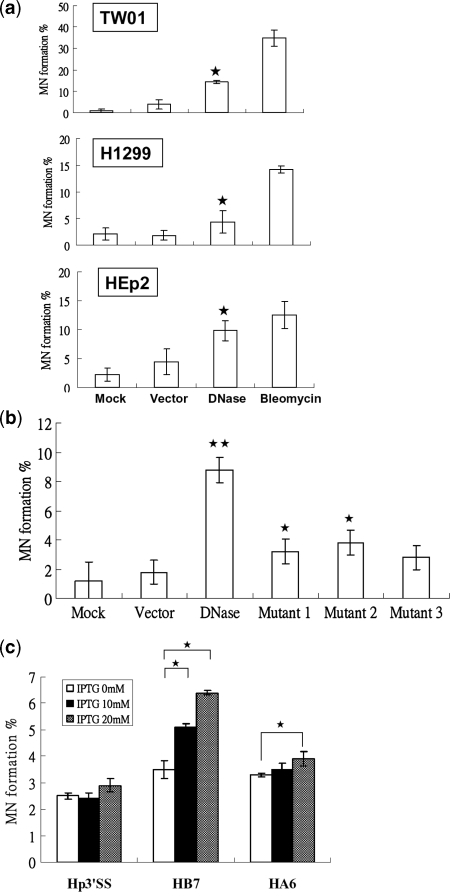
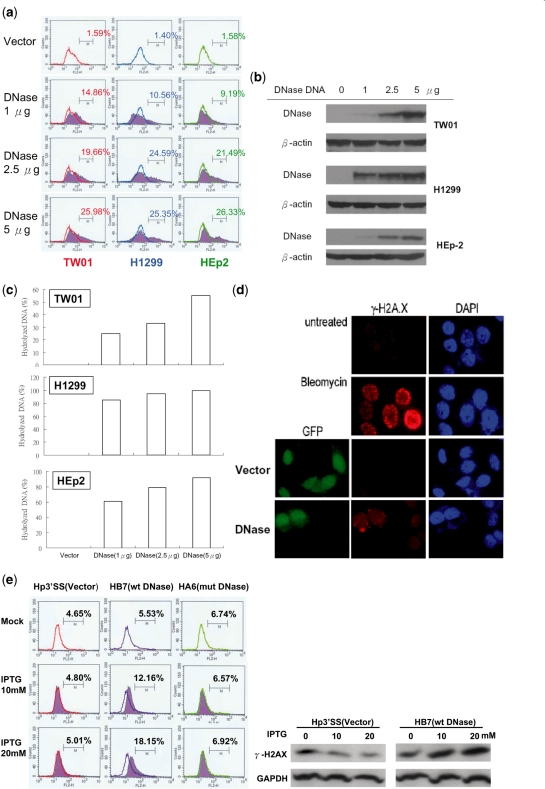
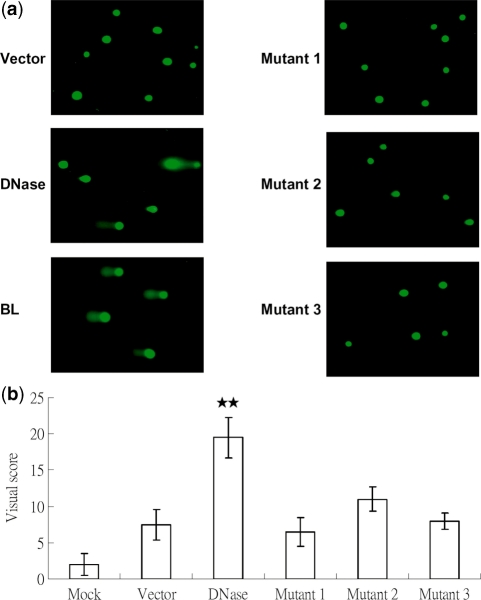
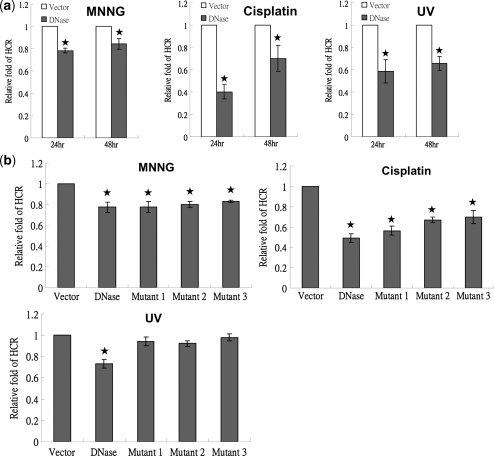
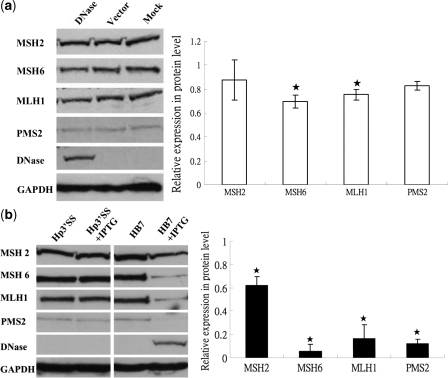
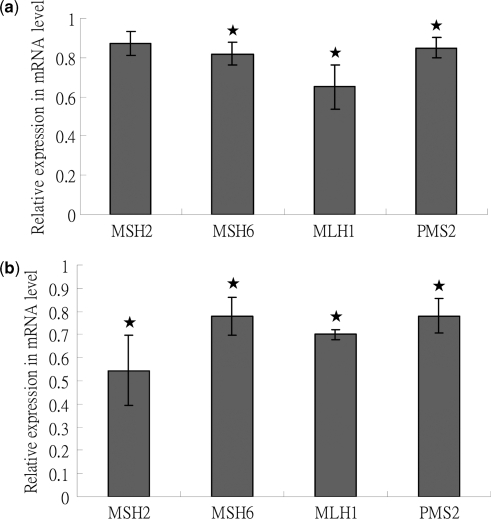
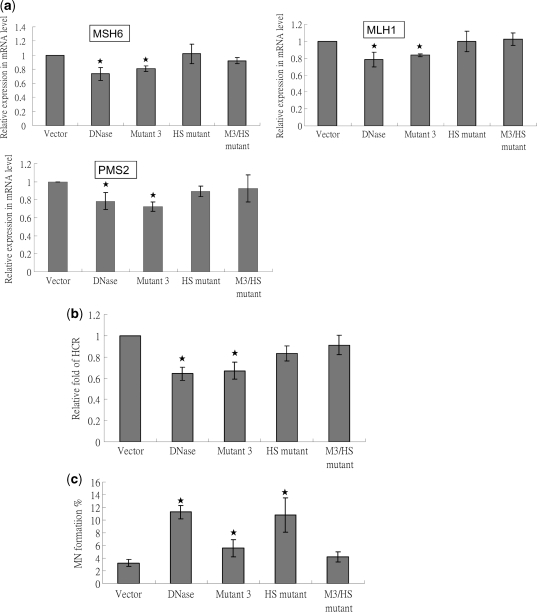
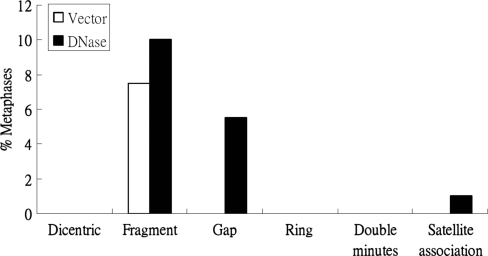
Epstein-Barr Virus (EBV) DNase (BGLF5) is an alkaline nuclease and has been suggested to be important in the viral life cycle. However, its effect on host cells remains unknown. Serological and histopathological studies implied that EBV DNase seems to be correlated with carcinogenesis. Therefore, we investigate the effect of EBV DNase on epithelial cells. Here, we report that expression of EBV DNase induces increased formation of micronucleus, an indicator of genomic instability, in human epithelial cells. We also demonstrate, using gammaH2AX formation and comet assay, that EBV DNase induces DNA damage. Furthermore, using host cell reactivation assay, we find that EBV DNase expression repressed damaged DNA repair in various epithelial cells. Western blot and quantitative PCR analyses reveal that expression of repair-related genes is reduced significantly in cells expressing EBV DNase. Host shut-off mutants eliminate shut-off expression of repair genes and repress damaged DNA repair, suggesting that shut-off function of BGLF5 contributes to repression of DNA repair. In addition, EBV DNase caused chromosomal aberrations and increased the microsatellite instability (MSI) and frequency of genetic mutation in human epithelial cells. Together, we propose that EBV DNase induces genomic instability in epithelial cells, which may be through induction of DNA damage and also repression of DNA repair, subsequently increases MSI and genetic mutations, and may contribute consequently to the carcinogenesis of human epithelial cells.


Figures

Figure 1.
Figure 1.
EBV DNase induces formation of MN in epithelial cells. (a) TW01, H1299 and HEp2 cells were mock transfected, transfected with vector control and DNase-expressing plasmid, and treated with bleomycin (1 µM) as positive control. Twenty-four hours post-transfection, cells were harvested and were stained by Hoechst for counting micronuclei. (b) TW01 cells were mock transfected or transfected with vector, DNase, Mutant 1(F452A), Mutant 2 (E225A/K227A) and Mutant 3 (E225A/K227A/F452A), respectively. 24 h post-transfection, cells were harvested and were stained by Hoechst for counting micronuclei. (c) Hp3′SS (vector control), HB7 (DNase-inducible clone), and HA6 (activity-null mutant F452A-inducible clone) were treated with various doses of IPTG. After 48 h induction, cells were stained by Hoechst for counting micronuclei. The counting numbers of MN positive-cells were represented in Supplementary Table S1. In all results, the values are a mean ±SD from at least three separate experiments. Asterisk denotes P < 0.05. Two asterisks denote P < 0.01.
Figure 2.
Figure 2.
EBV DNase increases γH2AX formation in epithelial cells. (a) TW01, H1299 and HEp2 cells were transfected with various doses of EBV DNase plasmid. Vector was added to adjust for equal DNA amount in each sample. Twenty four hours post-transfection, cells were collected and incubated with γH2AX antibody for cytometry analysis. In histogram, M is defined as the portion of γH2AX-positive cells. (b) Cell lysates were collected to examine protein expression by western blotting. (c) Cell lysates of various clones were collected and assayed for nuclease activity. Nuclease activity is defined as the percentage of hydrolyzed DNA which was digested by EBV DNase. (d) HEp2 cells were mock treated, treated with bleomycin (1 µM) for 24 h or transfected with vector or DNase-expressing plasmid. Twenty four hours post-transfection, cells were examined for phosphorylation of H2AX (red fluorescence), and cell nuclei were visualized with DAPI staining. Transfectants with vector and DNase were monitored with green fluorescence (GFP-positive). (e) Hp3′SS (vector control), HB7 (DNase-inducible clone), and HA6 (activity-null mutant F452A-inducible clone) were treated with various doses of IPTG. After 48 h induction, cells were harvested and incubated with γH2AX antibody for cytometry analysis. In histogram, M is defined as the portion of γH2AX-positive cells. The protein expression of γH2AX in Hp3′SS and HB7 cells was also detected by western analysis (right panel). (f) Cell lysates were collected for western blotting to examine EBV DNase expression. (g) Cell lysates were collected and assayed for nuclease activity. Nuclease activity is defined as the percentage of hydrolyzed DNA which was digested by EBV DNase.
Figure 3.
Figure 3.
The nuclease activity of EBV DNase is important for the effect of DNA damage. (a) TW01 cells were transfected with vector, DNase, Mutant 1, Mutant 2 and Mutant 3, respectively. After 24 h transfection, cells were collected for detection of DNA damage. DNA damage was analyzed by comet assay, which is as described in ‘Materials and Methods’ section. (b) The results of comet assay were quantitated by visual scoring. Visual scores were presented as classes 0–4 which increase with the level of genomic DNA damage (Supplementary Figure S1). All data presented represent the means and the standard deviations of at least three independent experiments. Two asterisks denote P < 0.01.
Figure 4.
Figure 4.
EBV DNase represses repair of chemical- and UV-damaged DNA. (a) TW01 cells were cotransfected with 2 μg/well of empty vector or a construct encoding DNase, together with a damaged or undamaged pCMV-luciferase reporter construct (pCMV-Luc, 0.1 μg/well) and Renilla reporter construct (0.1 μg/well). In the left panel, pCMV-Luc was pre-treated with MNNG (100 μM) for 3 h. In the middle panel, pCMV-Luc was pre-treated with cisplatin (10 μg/μl) for 3 h. In the right panel, pCMV-Luc was exposed to UV (2000 J/m2). Twenty-four hours and fourty-eight hours after cotransfection, luciferase activity and Renilla intensity were determined. Relative fold of HCR represents DNA repair activity, calculated as described in ‘Materials and Methods’ section. (b) TW01 cells were transfected with 2 μg/well of vector, DNase, Mutant 1, Mutant 2 or Mutant 3, together with an MNNG-treatment (100 μM) for 3 h, or cisplatin-treated (10 μg/μl), or UV-exposed (2000 J/m2), or undamaged pCMV-luciferase reporter construct (pCMV-Luc) (0.1 μg/well) and Renilla reporter construct (0.1 μg/well), respectively. Forty-eight hours after cotransfection, HCR assays were determined. Relative fold of HCR represents DNA repair activity, calculated as described in ‘Materials and Methods’ section. All data presented represent the means and the standard deviations of at least three independent experiments. Asterisk denotes P < 0.05.
Figure 5.
Figure 5.
EBV DNase decreases protein expressions of repair-related genes in epithelial cells. (a) In the left panel, 48 h post-transfection, the protein extracts of DNase and the empty vector transfected TW01 cells, and the parental TW01 cells (Mock) were examined by western blot using MSH2, MSH6, MLH1 and PMS2 antibodies. The detection of GAPDH was used as the loading control. In the right panel, the expression levels were quantified by densitometry. After standardizing with loading control, they were expressed as the relative expression compared with the vector controls. The values are a mean ± SD from three separate experiments. Asterisk denotes P < 0.05. (b) In the left panel, after 48 h IPTG (20 mM) induction or mock-treated, the protein extracts of Hp3′SS and HB7 were examined by western blot using MSH2, MSH6, MLH1 and PMS2 antibodies. The detection of GAPDH was used as the loading control. In the right panel, the expression levels were quantified. After standardization with loading control, they were expressed as the relative expression compared to those from the Hp3′SS vector controls. The values are a mean ±SD from three separate experiments. Asterisk denotes P < 0.05.
Figure 6.
Figure 6.
EBV DNase decreases mRNA amounts of MMR-related genes in epithelial cells. (a) Forty-eight hours post-transfection, total RNA of DNase and the empty vector transfected TW01 cells, and the parental TW01 cells were extracted. After RT, cDNA were examined for the mRNA expression of MSH2, MSH6, MLH1 and PMS2. The detection of GAPDH was used as the control. The expression level of each sample was standardized with that of GAPDH and then expressed as the relative expression compared to the vector controls. (b) After 48 h IPTG (20 mM) induction, total RNA of Hp3′SS and HB7 cells were extracted. After RT, cDNA were examined for the mRNA expression of MSH2, MSH6, MLH1 and PMS2. The detection of GAPDH was used as the control. The expression level of each sample was standardized with that of GAPDH and expressed as the relative expression compared to the decreased levels of vector controls. In all of results, the values are a mean ±SD from at least three separate experiments. Asterisk denotes P < 0.05.
Figure 7.
Figure 7.
Host shut-off mutants do not induce repair repression but the mutants with DNase activity induce MN formation in epithelial cells. (a) Total RNAs of vector, DNase and mutants transfected TW01 cells were extracted 48 h post-transfection. After RT, cDNA were examined for the mRNA expression of MSH6, MLH1 and PMS2 with GAPDH as the internal control. Then the relative expression compared to the vector control was presented. The values are a mean ±SD from at least three separate experiments. (b) TW01 cells were cotransfected with 2 μg/well of empty vector or a construct encoding DNase, together with a damaged or undamaged pCMV-luciferase reporter construct (pCMV-Luc, 0.1 μg/well) and Renilla reporter construct (0.1 μg/well). pCMV-Luc was pre-treated with cisplatin (10 μg/μl) for 3 h. Luciferase activity and Renilla intensity were determined 48 h after cotransfection. Relative fold of HCR represents DNA repair activity, calculated as described in ‘Materials and Methods’ section. (c) TW01 cells were transfected with vector control, DNase and mutants-expressing plasmids. Cells were harvested and were stained by Hoechst for counting micronuclei 24 h post-transfection. The values are a mean ±SD from at least three separate experiments. In all of results, asterisk denotes P < 0.05.
Figure 8.
Figure 8.
DNase induces chromosomal aberrations in epithelial cells. Chromosomal aberrations, including dicentric chromosomes, chromosome fragments, chromatid gaps, chromosome rings, double minutes and satellite associations were scored in 200 metaphase plates of DNase-expressing cells and vector control. The frequency of chromosomal aberrations was represented as the percentage of scoring metaphase plates.
Figure 9.
Figure 9.
EBV DNase enhances MSI and gene mutation. (a) Schematic representation of treatment with IPTG and blasticidin. Hp3′SS and HB7 cells were transfected with pBsd2-puro or pBsd4-puro, respectively, and then transfectants were selected with puromycin (1 µg/ml). Puromycin-resistant cells were collected and treated with 10 mM of IPTG or not for 6 days. These cells were maintained at a density of 2 × 10³ or 1 × 10⁴ cells per 100- mm culture dishes in the presence of blasticidin (5 µg/ml). After 14 days of incubation, the cells were stained with 0.05% p-iodonitrotetrazolium violet dye and then colonies larger than 1 mm were counted. (b) Hp3′SS or HB7 cells were transfected with pBsd2-puro or pBsd4-puro, and puromycin-resistant cells were mock treated (lanes 1, 3, 5 and 7) or treated with IPTG (lanes 2, 4, 6 and 8) for 24 h. Cell lysates were analyzed by western blotting with antibodies against EBV DNase and β-actin. (c) The frequency of gene mutation was calculated by dividing the number of blasticidin-resistant colonies by the number of cells seeded. The relative fold changes indicate the frequency of gene mutation in the presence of IPTG, calculated by dividing by that in the absence of IPTG. The values are a mean ±SD from three separate experiments. Two asterisks denote P < 0.01.

Similar articles

Cited by

References

    1. Kuzminov A. Recombinational repair of DNA damage in Escherichia coli and bacteriophage lambda. Microbiol. Mol. Biol. Rev. 1999;63:751–813. - PMC - PubMed
    1. Li L, Rohrmann GF. Characterization of a baculovirus alkaline nuclease. J. Virol. 2000;74:6401–6407. - PMC - PubMed
    1. Martinez R, Sarisky RT, Weber PC, Weller SK. Herpes simplex virus type 1 alkaline nuclease is required for efficient processing of viral DNA replication intermediates. J. Virol. 1996;70:2075–2085. - PMC - PubMed
    1. Porter IM, Stow ND. Virus particles produced by the herpes simplex virus type 1 alkaline nuclease null mutant ambUL12 contain abnormal genomes. J. Gen. Virol. 2004;85:583–591. - PubMed
    1. Young LS, Rickinson AB. Epstein-Barr virus: 40 years on. Nat. Rev. Cancer. 2004;4:757–768. - PubMed

Publication types

Substances