. 2010 Jan 15;123(Pt 2):171-80.
doi: 10.1242/jcs.057976. Epub 2009 Dec 21.

Interaction with surrounding normal epithelial cells influences signalling pathways and behaviour of Src-transformed cells

Affiliations

Interaction with surrounding normal epithelial cells influences signalling pathways and behaviour of Src-transformed cells

Mihoko Kajita et al. J Cell Sci. .

Abstract

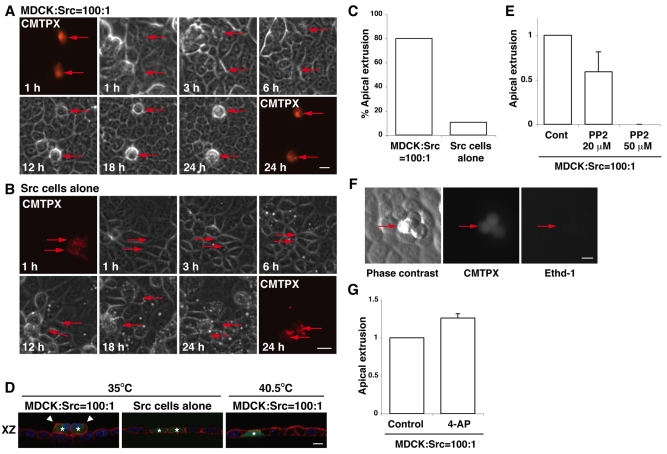
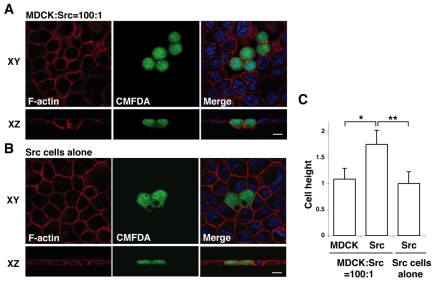
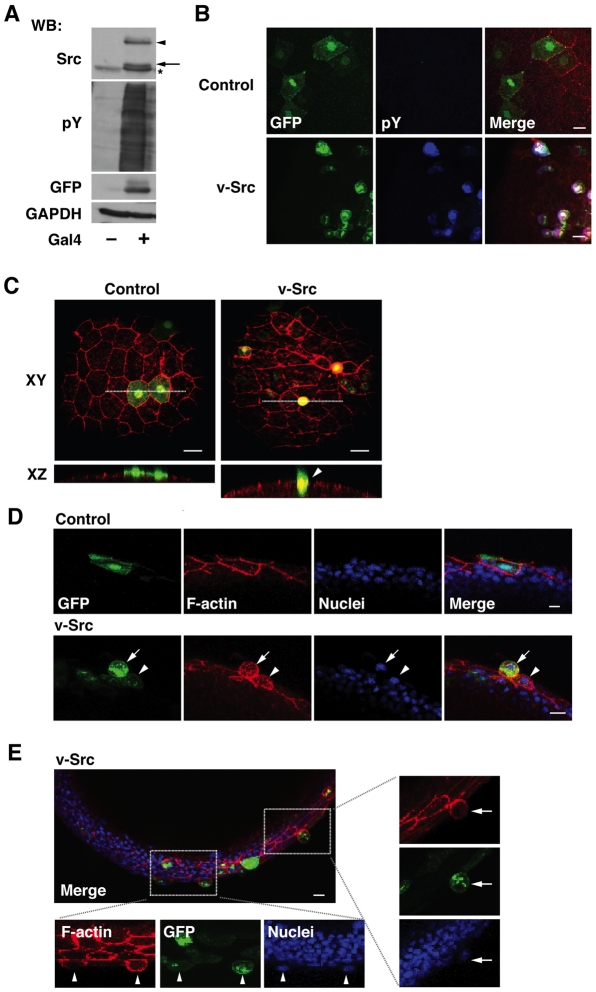
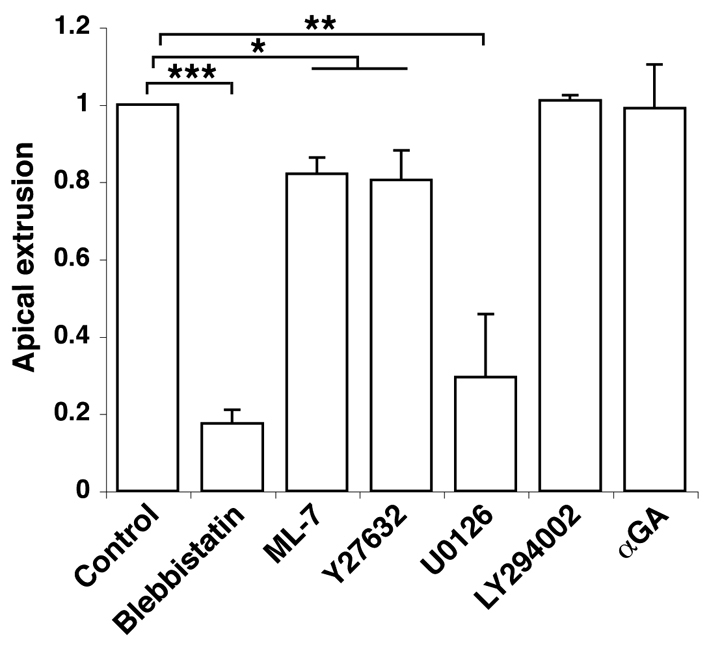
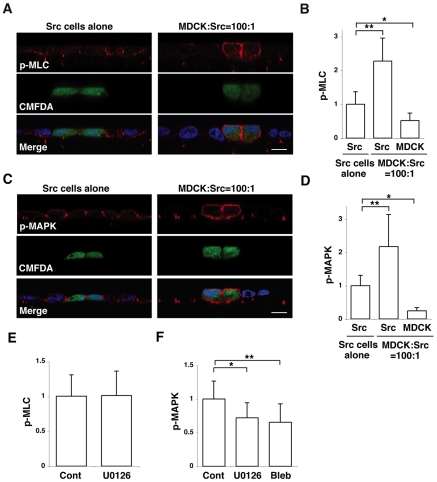
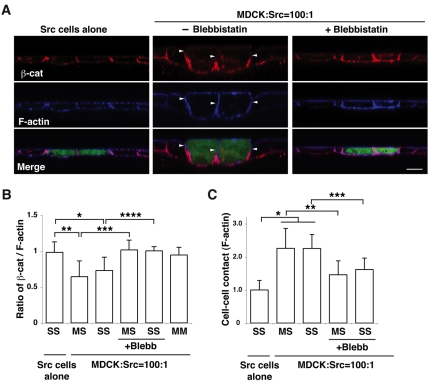
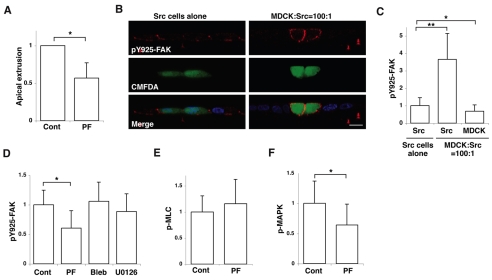
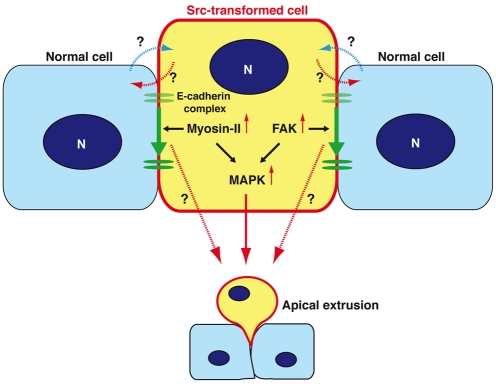
At the initial stage of carcinogenesis, transformation occurs in a single cell within an epithelial sheet. However, it remains unknown what happens at the boundary between normal and transformed cells. Using Madin-Darby canine kidney (MDCK) cells transformed with temperature-sensitive v-Src, we have examined the interface between normal and Src-transformed epithelial cells. We show that Src-transformed cells are apically extruded when surrounded by normal cells, but not when Src cells alone are cultured, suggesting that apical extrusion occurs in a cell-context-dependent manner. We also observe apical extrusion of Src-transformed cells in the enveloping layer of zebrafish gastrula embryos. When Src-transformed MDCK cells are surrounded by normal MDCK cells, myosin-II and focal adhesion kinase (FAK) are activated in Src cells, which further activate downstream mitogen-activated protein kinase (MAPK). Importantly, activation of these signalling pathways depends on the presence of surrounding normal cells and plays a crucial role in apical extrusion of Src cells. Collectively, these results indicate that interaction with surrounding normal epithelial cells influences the signalling pathways and behaviour of Src-transformed cells.


Figures

Fig. 1.
Fig. 1.
Src-transformed cells are apically extruded from a monolayer of normal epithelial cells in a cell death-independent manner. (A,B) ts-Src MDCK cells are apically extruded when they are surrounded by normal MDCK cells, but not when surrounded by ts-Src MDCK cells. ts-Src MDCK cells were stained with a fluorescent dye (CMTPX, red) and mixed with normal MDCK cells (A) or ts-Src MDCK cells (B), followed by a temperature shift (35°C). Images are extracted from a representative time-lapse analysis. Red arrows indicate fluorescently labelled Src cells. (C) Quantification of time-lapse analyses of ts-Src MDCK cells extruded from a monolayer of normal MDCK cells or from that of ts-Src MDCK cells within 24 hours after the temperature shift (n=90 for the former and n=72 for the latter from 4-5 independent experiments). (D) Immunofluorescence images of XZ sections of ts-Src MDCK cells (stained with CMFDA, green) that are surrounded by normal MDCK cells (left and right panels) or by ts-Src MDCK cells (middle panel). Cells were cultured at 35°C or 40.5°C for 24 hours, and were stained with phalloidin (red) and Hoechst 33342 (blue). Asterisks and arrowheads indicate fluorescently labelled Src cells and extruded Src cells, respectively. (E) Quantification of apical extrusion of Src cells in the absence or presence of PP2. (F) Extruded ts-Src MDCK cells remain alive on a monolayer of normal MDCK cells. The mixture of normal and Src cells were stained with ethidium homodimer-1 (Ethd-1) for 8 hours after 16 hours of the temperature shift. Red arrows indicate extruded Src cells. (G) Quantification of apical extrusion of Src cells in the absence or presence of 4-AP. Values in E and G are expressed as a ratio relative to control. Data are mean ± s.d. from three (E) or two (G) independent experiments. Scale bars: 20 μm (A,B) or 10 μm (D,F).
Fig. 2.
Fig. 2.
Morphological changes of Src-transformed cells that are surrounded by normal epithelial cells. (A,B) Immunofluorescence images of ts-Src MDCK cells (stained with CMFDA, green) that are surrounded by normal MDCK cells (A) or by ts-Src MDCK cells (B). Cells were stained with phalloidin (red) and Hoechst 33342 (blue) after 16 hours of the temperature shift. Scale bars; 10 μm. (C) Quantification of cell height. Data are mean ± s.d. *P<5×10⁻²³, **P<2×10⁻²⁴; n=46, 48 and 53 cells from three independent experiments. Values are expressed as a ratio relative to Src cells alone.
Fig. 3.
Fig. 3.
v-Src-expressing cells are apically extruded from a monolayer of the enveloping layer (EVL) in zebrafish embryos. (A) Gal4-dependent expression of v-Src. pBR-Tol2-UAS-GAP43-GFP-SC-v-Src was transfected without or with pCS2-Gal4FF in HEK293 cells. Cell lysates were examined by western blotting using anti-Src, anti-phospho-tyrosine (pY), and anti-GFP antibodies. Equal protein loading was confirmed using anti-GAPDH antibody. In this system, the expressed proteins (GAP43-GFP-SC-v-Src) were cleaved at the self-cleaving peptide sequence (SC), leading to expression of GAP43-GFP and v-Src. Arrowhead and arrow indicate non-cleaved GAP43-GFP-SC-v-Src and cleaved v-Src, respectively. The asterisk indicates endogenous c-Src. (B) Immunofluorescence images of embryos at 9 hours post-fertilization (hpf) (90% epiboly), injected with the control (upper panels) or v-Src-expressing vector (lower panels) at the one- to two-cell stage. Embryos were stained with phalloidin (red) and anti-pY antibody (blue). (C-E) Immunofluorescence images of zebrafish embryos (at 8-9 hpf), injected with the control or v-Src-expressing vector at the one- to two-cell stage. Embryos were stained with phalloidin (red) and/or Hoechst 33342 (blue). Surface views (C) and semi-lateral views (D,E) of embryos. (C) White dotted lines in XY panels denote cross-section represented in XZ sections. (E) The areas in the white box are shown in higher magnification. (C-E) Arrowheads and arrows indicate v-Src-expressing cells with increased cell height and extruded v-Src-expressing cells, respectively. Representative images are shown from 18 and 30 embryos that were injected with the control or v-Src-expressing vector respectively, from three independent experiments. Scale bars: 20 μm (B), 40 μm (C) and 10 μm (D,E).
Fig. 4.
Fig. 4.
Quantification of apical extrusion of Src cells with various inhibitors. ts-Src MDCK cells were cultured with normal MDCK cells in the presence of various inhibitors, and apical extrusions of the Src cells were analysed after 24 hours of the temperature shift. Data are mean ± s.d. from three independent experiments for Blebbistatin, Y27632 and U0126, or from two independent experiment for ML-7, LY294002, and αGA. *P<0.03, **P<0.002, ***P<0.0002. Values are expressed as a ratio relative to control.
Fig. 5.
Fig. 5.
Activity of myosin-II and MAPK is further enhanced in Src cells when they are surrounded by normal cells. (A,C) Immunofluorescence images of XZ sections of Src cells (stained with CMFDA, green) surrounded by Src cells (left panels) or by normal MDCK cells (right panels). Cells were stained with Hoechst 33342 (blue) and anti-MLC-P (p-MLC) antibody (A, red) or anti-MAPK-P (p-MAPK) antibody (C, red). Scale bars; 10 μm. (B,D) Quantification of immunofluorescence of MLC-P (B) or MAPK-P (D). Data are mean ± s.d. (B) *P<4×10⁻⁷, **P<6×10⁻¹⁵; n=38, 37 and 33 cells from three independent experiments. (D) *P<5×10⁻¹⁶, **P<3×10⁻¹¹; n=45, 42 and 23 cells from three independent experiments. (E,F) Quantification of immunofluorescence of MLC-P (E) or MAPK-P (F) in Src cells that were cultured with normal MDCK cells in the presence of the indicated inhibitors. It should be noted that Blebbistatin suppresses ATPase activity of myosin-II without affecting the phosphorylation of MLC, thus the effect of Blebbistatin on MLC-P was not examined. Data are mean ± s.d. (E) n=80 and 62 cells from four independent experiments. (F) *P<0.0001, Z=4.2; **P<0.0001, Z=5.4; n=51, 28 and 40 cells from three independent experiments. Values are expressed as a ratio relative to Src cells alone (B,D) or to control (E,F). Two-tailed Student's t tests were used to determine P-values, except for Fig. 5F where Mann-Whitney U-tests were used.
Fig. 6.
Fig. 6.
β-catenin is basally relocalized in Src-transformed cells that are surrounded by normal cells. (A) Immunofluorescence of XZ sections of β-catenin and F-actin. ts-Src MDCK cells were stained with CMFDA (green) and cultured with ts-Src MDCK cells (left panels) or with normal MDCK cells (middle and right panels) in the absence or presence of Blebbistatin. Cells were stained with anti-β-catenin antibody (red) and phalloidin (blue). Scale bar: 10 μm. Arrowheads indicate the lateral membrane domain where immunofluorescence of β-catenin is absent but that of F-actin is present. (B) Quantification of the length of lateral membrane domains with β-catenin—F-actin fluorescence. The length of basolateral domains stained with β-catenin or F-actin was measured, and the ratio of the length (β-catenin—F-actin) was calculated. MM, between normal MDCK cells; MS, between normal and ts-Src MDCK cells; SS, between ts-Src MDCK cells. Data are mean ± s.d. *P<4×10⁻¹¹, **P<4×10⁻²⁷, ***P<9×10⁻²⁹, ****P<8×10⁻⁸; n=101, 87, 27, 81, 20 and 64 cell-cell contact sites from three independent experiments. (C) Quantification of the length of cell-cell contact area. The length of cell-cell contact area stained with F-actin was measured. Data are mean ± s.d. *P<2×10⁻²⁸, **P<2×10⁻¹⁷, ***P<7×10⁻⁶; n=84, 78, 19, 80 and 21 cell-cell contact sites from three independent experiments. Values are expressed as a ratio relative to cell-cell contact sites between ts-Src MDCK cells where ts-Src MDCK cells alone are cultured.
Fig. 7.
Fig. 7.
FAK is involved in apical extrusion of Src cells. (A) Quantification of apical extrusion of ts-Src MDCK cells that are surrounded by normal MDCK cells in the absence or presence of PF573228 (PF). Data are mean ± s.d. from three independent experiments. *P<0.02. (B) Immunofluorescence of XZ sections of Y925-P of FAK (pY925-FAK) in ts-Src MDCK cells (stained with CMFDA, green) surrounded by ts-Src MDCK cells (left panels) or by normal MDCK cells (right panels). Cells were stained with anti-Y925-P-FAK antibody (red) and Hoechst 33342 (blue). Scale bar: 10 μm. (C) Quantification of immunofluorescence of Y925-P-FAK in normal or Src cells. Data are mean ± s.d. *P<2×10⁻⁶, **P<1×10⁻³²; n=61, 59 and 59 cells from three independent experiments. (D-F) Quantification of immunofluorescence of Y925-P-FAK (D), MLC-P (E) or MAPK-P (F) in Src cells that are surrounded by normal cells in the absence or presence of inhibitors. Data are mean ± s.d. (D) *P<0.0001, Z=6.1; n=55, 51, 65 and 39 cells from three independent experiments. (E) n=52 and 46 cells from three independent experiments. (F) *P<0.0001, Z=4.7; n=54 and 53 cells from three independent experiments. Values are expressed as a ratio relative to control (A,D-F) or Src cells alone (C). Two-tailed Student's t tests were used to determine P-values, except for Fig. 7D,F where Mann-Whitney U-tests were used.
Fig. 8.
Fig. 8.
Molecular mechanisms of apical extrusion of Src cells. In Src cells that are surrounded by normal cells, activity of myosin-II and FAK is increased, leading to activation of the downstream MAPK pathway. Activity of myosin-II, FAK and MAPK is involved in apical extrusion of Src cells. In addition, E-cadherin-based cell-cell adhesions are basally relocalized in a myosin-II- and FAK-dependent manner. N, nucleus.

Similar articles

Cited by

References

    1. Abraham V., Chou M. L., DeBolt K. M., Koval M. (1999). Phenotypic control of gap junctional communication by cultured alveolar epithelial cells. Am. J. Physiol. 276, L825-L834 - PubMed
    1. Asakawa K., Suster M. L., Mizusawa K., Nagayoshi S., Kotani T., Urasaki A., Kishimoto Y., Hibi M., Kawakami K. (2008). Genetic dissection of neural circuits by Tol2 transposon-mediated Gal4 gene and enhancer trapping in zebrafish. Proc. Natl. Acad. Sci. USA 105, 1255-1260 - PMC - PubMed
    1. Baker N. E., Li W. (2008). Cell competition and its possible relation to cancer. Cancer Res. 68, 5505-5507 - PubMed
    1. Behrens J., Vakaet L., Friis R., Winterhager E., Van Roy F., Mareel M. M., Birchmeier W. (1993). Loss of epithelial differentiation and gain of invasiveness correlates with tyrosine phosphorylation of the E-cadherin/beta-catenin complex in cells transformed with a temperature-sensitive v-SRC gene. J. Cell Biol. 120, 757-766 - PMC - PubMed
    1. Brumby A. M., Richardson H. E. (2003). scribble mutants cooperate with oncogenic Ras or Notch to cause neoplastic overgrowth in Drosophila. EMBO J. 22, 5769-5779 - PMC - PubMed

Publication types

MeSH terms

LinkOut - more resources