Review
. 2009 Aug;42(3):159-200.
doi: 10.1017/S0033583509990060.

Elongation in translation as a dynamic interaction among the ribosome, tRNA, and elongation factors EF-G and EF-Tu

Affiliations
Review

Elongation in translation as a dynamic interaction among the ribosome, tRNA, and elongation factors EF-G and EF-Tu

Xabier Agirrezabala et al. Q Rev Biophys. 2009 Aug.

Abstract

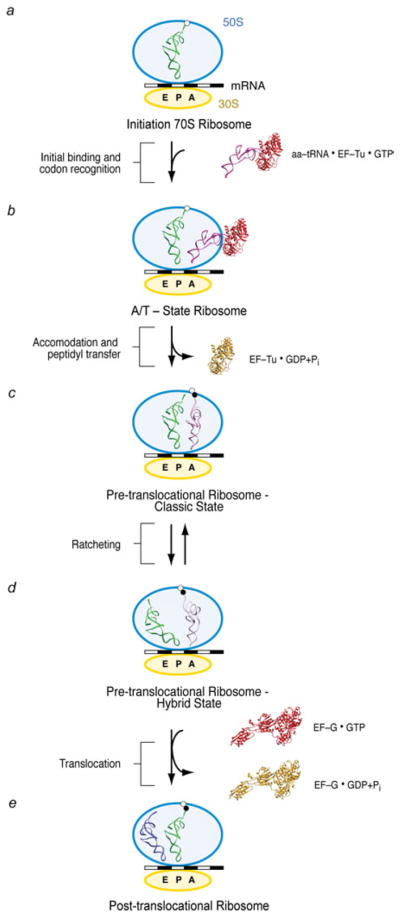
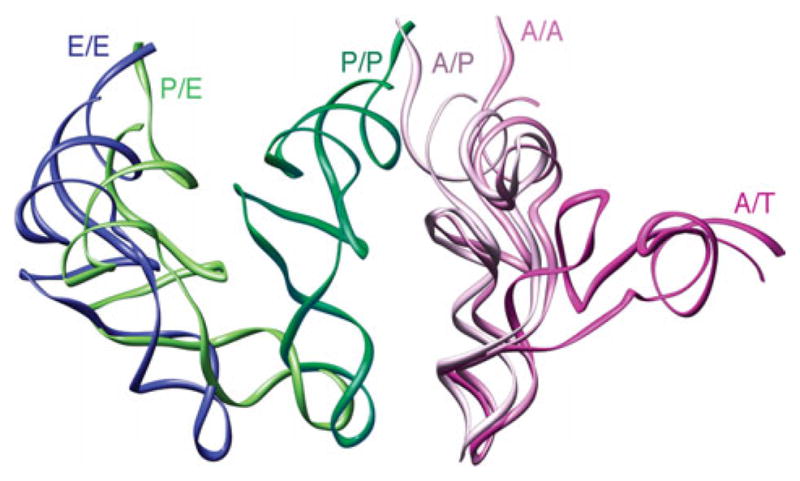
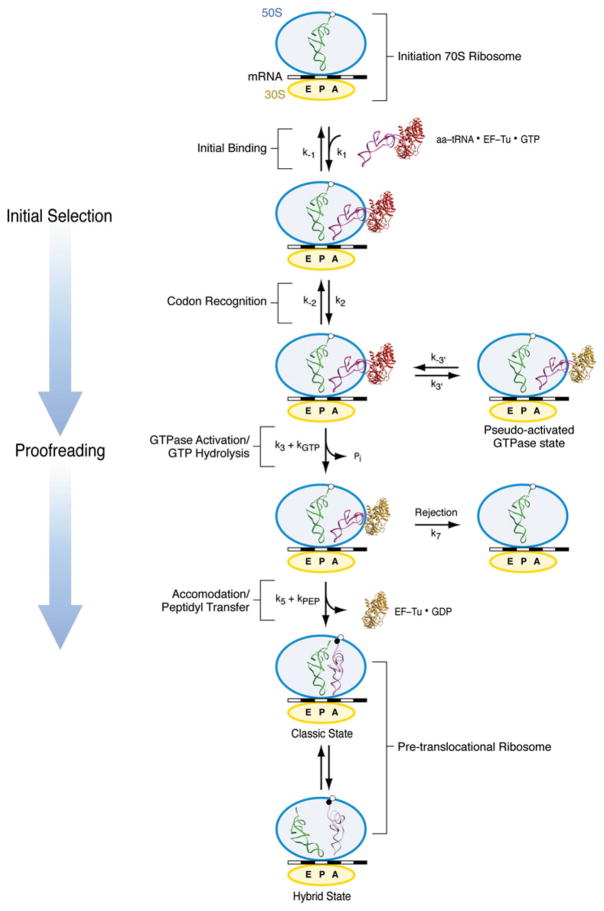
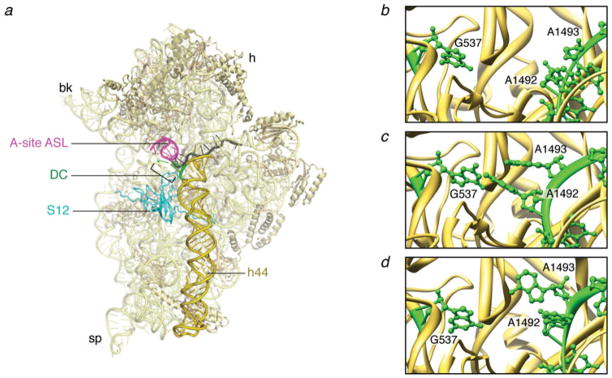
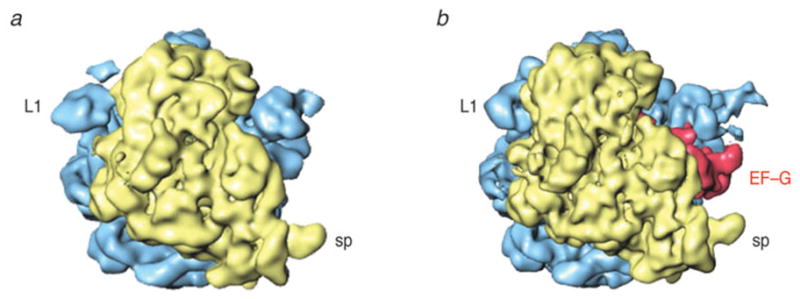
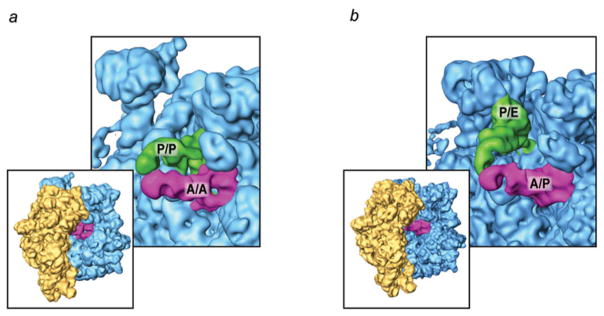
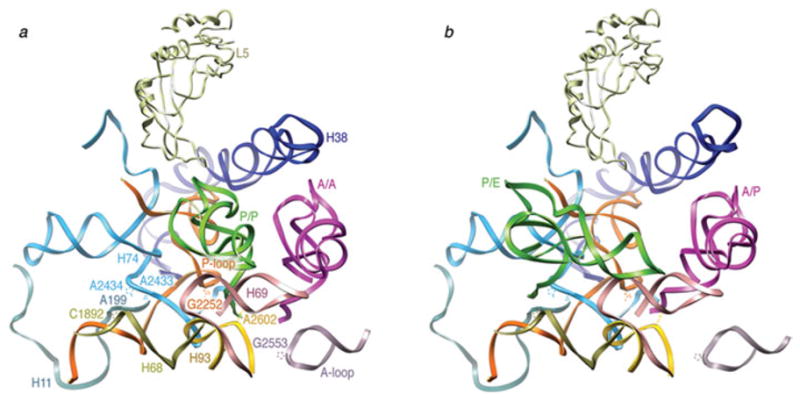
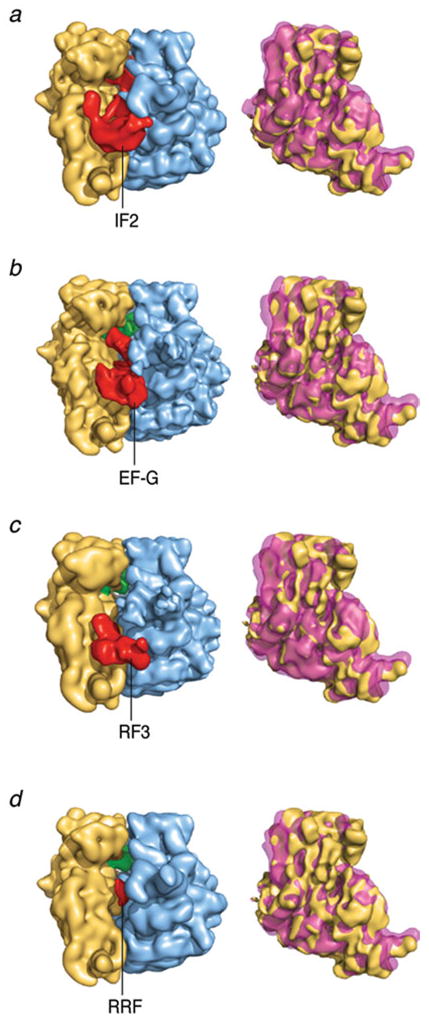
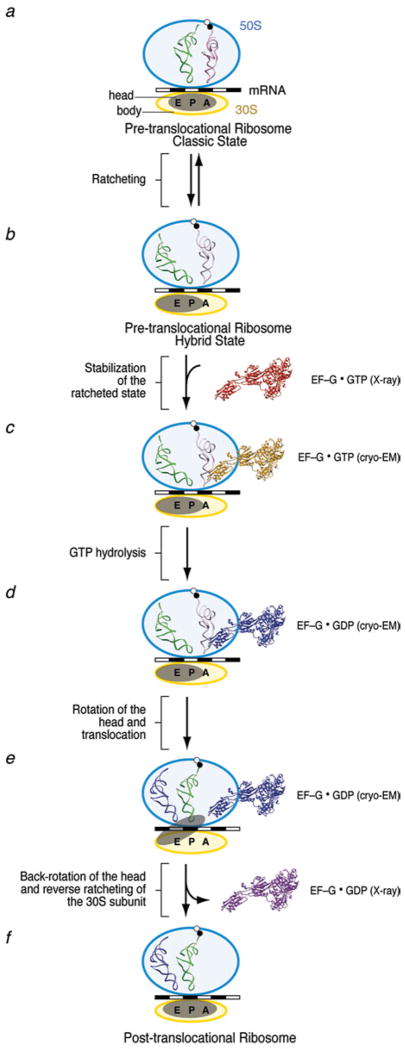
The ribosome is a complex macromolecular machine that translates the message encoded in the messenger RNA and synthesizes polypeptides by linking the individual amino acids carried by the cognate transfer RNAs (tRNAs). The protein elongation cycle, during which the tRNAs traverse the ribosome in a coordinated manner along a path of more than 100 A, is facilitated by large-scale rearrangements of the ribosome. These rearrangements go hand in hand with conformational changes of tRNA as well as elongation factors EF-Tu and EF-G - GTPases that catalyze tRNA delivery and translocation, respectively. This review focuses on the structural data related to the dynamics of the ribosomal machinery, which are the basis, in conjunction with existing biochemical, kinetic, and fluorescence resonance energy transfer data, of our knowledge of the decoding and translocation steps of protein elongation.


Figures

Fig. 1
Fig. 1
General overview of the protein elongation cycle. Once the initiation ribosome bearing an fMet-tRNAfMet in the P site is formed (a), the first aa-tRNA is incorporated (b). The cognate codon–anticodon match triggers GTP hydrolysis on EF-Tu and EF-Tu release. The accommodation of the aa-tRNA (c) is immediately followed by peptide bond transfer. At this stage, the pre-translocational ribosome samples the hybrid A/P and P/E states, a reconfiguration coupled to the ratchet motion of the 30S subunit (d). In the last step of the protein elongation cycle, the GTPase EF-G catalyzes the complete translocation of the mRNA–(tRNA)2 complex (e), freeing up the A site for the next aa-tRNA.
Fig. 2
Fig. 2
Comparison between the positions and orientations of the tRNAs in the ribosome at different sites. The tRNA positions and conformations (displayed in ribbons) were obtained by fitting of the experimental cryo-EM densities with the X-ray structure of the tRNAs by real-space refinement.
Fig. 3
Fig. 3
Kinetic scheme for aa-tRNA incorporation. Initial selection starts with a codon-independent, reversible rapid initial binding of the ternary complex (k1, k−1). During codon recognition, the codon–anticodon interaction is still labile and reversible (k2, k−2). Once the cognate codon–anticodon match is recognized, the ternary complex is stabilized and a signal transmitted to GTPase EF-Tu calling for activation (k3) and GTP hydrolysis (k4=kGTP). In the reversible, short life-time, pseudo-activated GTPase state, the cognate ternary complex establishes initial unsuccessful contacts with the ribosome (k3′, k−3′). Once GTP is hydrolyzed, the release of Pi and subsequent conformational change of EF-Tu leads to the dissociation of the factor from the ribosome and the accommodation of the aminoacyl end of the tRNA into the A site of the 50S subunit (k5). Accommodation is followed by rapid peptide bond transfer (k6=kpep). In case of rejection, the aa-tRNA dissociates from the ribosome (k7). After peptide bond transfer, the pre-translocational ribosome alternates between the classic and hybrid states.
Fig. 4
Fig. 4
The interactions at the decoding center. (a) Crystal structure of the 30S subunit (PDB code: 2J00). (b) Close-up of the decoding center in the absence of mRNA (PDB code: 1J5E). (c) Close-up of the decoding center in the presence of cognate mRNA (PDB code: 1IBM). (d) Close-up of the decoding center in the presence of a near-cognate mRNA (PDB code: 1N34). The structures are displayed in Ribbons. Labels and landmarks: sp, spur; bk, beak; h, head; S12, protein S12; DC, decoding center; h44, helix 44; A-tRNA/ASL, A-site tRNA ASL.
Fig. 5
Fig. 5
Cryo-EM reconstruction of ribosome bearing mRNA and a cognate ternary complex stalled with kirromycin after GTP hydrolysis. Cryo-EM map of the 70S•fMet-tRNAfMet•Trp-tRNATrp•EF-TuGDP•kir complex (X. Agirrezabala, J. Lei, R. F. Ortiz-Meoz, R. Green, & J. Frank, unpublished results). Cryo-EM densities are shown for the small (yellow) and large (blue) subunits, A- and P-site tRNAs (magenta and green, respectively), and EF-Tu (red). (a) Side view of 70S ribosome, (b) interface view of 30S subunit, (c) interface view of 50S subunit, (d) arrangement of P-site tRNA and ternary complex. Labels and landmarks: sp, spur; pt, platform; h, head; CP, central protuberance; L1, L1 stalk; L7/L12, L7/L12 stalk.
Fig. 6
Fig. 6
Interactions between ribosome and ternary complex and between ribosome and A-site tRNA, inferred by real-space refinement of cryo-EM density maps. (a) Structural elements located around A/T-tRNA in the fitting model of the 70S ribosomal complex bearing Phe-tRNAPhe. tRNA (pink), EF-Tu (red), SRL (blue), L11(green), rRNA in the GAC (light blue), S12 (orange), H69 (dark blue), fragments of h44 and h18 (dark green). (b) Interactions of tRNA in the A site, from X-ray structure (PDB code: 1GIX), with its surrounding elements from X-ray structure (PDB code: 2AVY): S12 (orange); h44 fragment (green); H69 (blue). Protein S12 in PDB files 2AVY and 1GIX were aligned. This figure was altered for the purposes of this article. Data adapted from Li et al. (2008), copyright (2008) Nature Publishing Group.
Fig. 7
Fig. 7
GTP hydrolysis on EF-Tu. (a) Cryo-EM map of the 70S•fMet-tRNAfMet•Phe-tRNAPhe•EF-TuGDP•kir complex. Cryo-EM densities are shown for the small (yellow) and large (blue) subunits, A-, P-, and E-site tRNAs (magenta green and orange, respectively), and EF-Tu (red) as transparent surface, along with the atomic model (shown in cartoon representation) obtained by flexible fitting using MDFF. (b) Switch regions in the MDFF-generated atomic model of ribosome-bound EF-Tu: Switch I (Sw1, blue), Switch II (Sw2, orange), and P-loop (green). (c) Close-up of the GTPase domain of EF-Tu. The cryo-EM density map is displayed at a lower threshold compared to that in panel (b) (1·4σ versus 2·2σ) to make the Switch I density visible. Data reproduced from Villa et al. (2009a), copyright (2009) National Academy of Sciences.
Fig. 8
Fig. 8
Hydrophobic gate in EF-Tu. (a) Schematic depiction of the hydrophobic gate formed by residues Ile60 and Val20, which prevents His84 from activating the water molecule and catalyzing the hydrolysis of GTP. (b) Close-up of the gate of the X-ray structure of the ternary complex bound to kirromycin in the presence of GDPNP (PDB code: 1OB2). (c) Close-up of the ribosome-bound ternary complex model obtained through MDFF. The movement of Switch I opens the gate on the Ile60 side; the acceptor stem of the tRNA moves closer to Switch II, and the side-chain of His84 is repositioned toward the nucleotide, resulting in catalysis of GTP hydrolysis. (d) Close-up of the hydrophobic gate in the open position as seen in the crystal structure of the aurodox-bound ternary complex in the presence of GDP (PDB code: 1HA3). The conformation of the gate is very similar to that shown in panel (c). A GTP molecule is shown in all panels for comparison purposes. Data reproduced from Villa et al. (2009a), copyright (2009) National Academy of Sciences.
Fig. 9
Fig. 9
Ratchet motion of the E. coli ribosome observed with binding of EF-G. (a) Normal (MSI) conformation; (b) Conformation (MSII) after ratchet-like rotation of the 30S subunit, with EF-G (red) bound. Labels and landmarks: sp (spur), L1 (L1 stalk). This figure was altered for the purposes of this article. Data adapted from Valle et al. (2003b), copyright (2003) Cell Press.
Fig. 10
Fig. 10
Spontaneous ratchet motion: classic and hybrid ribosome configurations. (a) Classic A/A and P/P tRNA positions, with ribosome in MSI conformation; (b) hybrid A/P and P/E tRNA positions, with ribosome in MSII conformation.
Fig. 11
Fig. 11
tRNA environment in the large subunit. (a) Close-up of the 50S subunit showing the classic tRNA configuration. (b) Close-up of the 50S subunit showing the hybrid tRNA configuration. Protein L5, as well as 23S rRNA fragments 197–228 (H11), 1189–1905 (H68), 2586–2608 (H93), 2547–2564 (A-loop), 1906–1934 (H69), 2227–2286 (P-loop), and 2372–2451 (H74) are shown. Residues C1892 (H68), A2602 (H93), G2252 (P-loop), A2433 and A2434 (H74), and G2553 (A-loop) are highlighted. The fitting was done by real space refinement. Data reproduced from Agirrezabala et al. (2008), copyright (2008) Cell Press.
Fig. 12
Fig. 12
Ratchet motion induced by binding of ribosomal factors. (left) Cryo-EM density maps of 70S ribosome with factors bound; right column: density maps of the 30S subunit overlaid in MSI and MSII positions. This figure was altered for the purposes of this article. Data adapted from Frank et al. (2007), copyright (2007) National Academy of Sciences.
Fig. 13
Fig. 13
Extent of ratchet-related motions induced by the binding of EF-G and RF3. Color mapping was used to display the factor-induced displacements of rRNA residues on the structure of the unbound ribosome (i.e., MSI). (a, c) 16S and 23S rRNA responding to binding of EF-G; (b, d) 16S and 23S rRNA responding to binding of RF3. Data reproduced from Gao et al. 2009, copyright (2009) Springer Publishing.
Fig. 14
Fig. 14
16S rRNA secondary structure mapping of ratchet-related motions induced by the binding of EF-G and RF3. Displacements of residues upon factor binding are mapped onto the initial (MSI) secondary structure following a color-coding scheme. Displacements above 1·25 Å (blue) are significant. This display focuses on movements up to 5 Å – displacements larger than 5 Å are all displayed in black. Data reproduced from Gao et al. (2009), copyright (2009) Springer Publishing.
Fig. 15
Fig. 15
A possible intermediate during tRNA hybrid reconfiguration. Single-molecule FRET data appear to indicate the existence of an A/A–P/E intermediate, which equilibrates with the classic A/A–P/P and the fully hybrid A/P–P/E configuration.
Fig. 16
Fig. 16
Cryo-EM reconstruction of EF-GGDPNP bound ribosomes. (a) Cryo-EM densities are shown for the small (yellow) and large (blue) subunits, P/E tRNA (green), and EF-G (red). (b) Manually fitted EF-GGDP structure (PDB code: 1FNM) in the cryo-EM density for EF-GGDPNP (semitransparent red). Relative movements between domains were allowed during the docking procedure. Domains I and II do not require any relative movement compared to their position in the EF-G•GDP crystal structure and they were fitted as one piece. In contrast, domains III, IV, and V shift and rotate jointly, moving the tip of domain IV by approximately 37 Å (see arrow). Labels and landmarks: sp, spur; pt, platform; h, head; CP, central protuberance; L1, L1 stalk; L7/L12, L7/L12 stalk. This figure was altered for the purposes of this article. Data adapted from Valle et al. (2003b), copyright (2003) Cell Press.
Fig. 17
Fig. 17
Cryo-EM reconstruction of eEF-2 bound 80S ribosomes. Cryo-EM densities are shown for the small (yellow) and large (blue) subunits, P/E tRNA (green), and eEF2 (red). (a) Cryo-EM map of 80S•eEF2•GDPNP, (b) 80S•ADPR-eEF2•GDPNP, (c) 80S•ADPR-eEF2•GDP•sordarin. Density attributed to the ADPR moiety is circled in (b). Labels and landmarks: bk, beak; h, head; st, stalk; CP, central protuberance; L1, L1 stalk. This figure was altered for the purposes of this article. Data adapted from Taylor et al. (2007), copyright (2007) Nature Publishing Group.
Fig. 18
Fig. 18
Conformational changes in ADPR-eEF2 as a direct result of GTP hydrolysis. (a) Density attributed to ADPR-eEF2 from the 80S•ADPR-eEF2•GDPNP map (red) is virtually superimposable with that from the 80S•ADPR-eEF2•GDPNP•sordarin map (gray), a map equivalent to the 80S•ADPR-eEF2•GDPNP shown in Fig. 18b (see Taylor et al. 2007 for details). Conversely, superimposition of density attributed to ADPR-eEF2 from the 80S•ADPR-eEF2•GDP•sordarin map (blue) with that from the 80S•ADPR-eEF2•GDPNP•sordarin map (gray) demonstrates significant conformational changes in the factor that are due exclusively to GTP hydrolysis. (b) The atomic models from the 80S•ADPR-eEF2•GDPNP (red) and 80S•ADPReEF2•GDPNP•sordarin (gray) complexes are very similar, whereas a comparison of the 80S•ADPR-eEF2•GDP•sordarin (blue) and 80S•ADPR-eEF2•GDPNP•sordarin (gray) atomic models shows evidence of rearrangements due to GTP hydrolysis. The arrows indicate the direction and magnitude of the conformational changes of the factor. All atomic models in this figure were obtained by flexible fitting using real-space refinement. Data reproduced from Taylor et al. (2007), copyright (2007) Nature Publishing Group.
Fig. 19
Fig. 19
Comparison of structural changes observed in EF-G. (a) The conformational changes observed in EF-G involve a hinge-like movement of the C-terminal domains (III, IV, and V) with respect to the N-terminal domains (I, II, and G′). (b) The conformations observed in EF-G/eEF2 by means of cryo-EM (ribosome-bound forms) and X-ray crystallography (in solution) can be summarized as follows: EF-G in complex with GTP in solution (red), before interacting with the ribosome, as seen in the crystal structure of the EF-G analog EF-G-2 (PDB code: 1WDT). When EF-G•GTP binds to the ribosome, the conformational change of EF-G causes a shift in the tip of domain IV (structure show in yellow). EF-G in the new conformation likely stabilizes the ribosome in the ratcheted conformation. This EF-G•GTP•ribosome conformation was determined by cryo-EM using the nonhydrolyzable GTP analog GDPNP (PDB code: 1PN6). The conformational changes in ribosome-bound EF-G, upon GTP hydrolysis, are likely similar to those described for eEF2•80S complexes in Taylor et al. (2007). A comparison of the complexes before (yellow) and after GTP hydrolysis (blue, PDB code: 2P8Y) reveals small magnitude shifts in domains I, II, and G′ toward the GAC of the ribosome, a reorganization of the Switch I loop, and an ~6-Å shift in domain IV toward the decoding center of the ribosome. This movement is thought to sever the connection between the decoding center in the body of the small subunit and the A-site mRNA–tRNA duplex bound to the head of the small subunit, so that movement of the mRNA–tRNA complex can occur via a head rotation of the small subunit. Conformational changes of EF-G•GDP from the ribosome-bound conformation (blue), determined by cryo-EM (PDB code: 2P8Y), to the solution structure (pink), determined by X-ray crystallography (PDB code: 1EFG), include a movement at the tip of domain IV by ~43 Å. This conformational change in EF-G likely contributes to its dissociation from the ribosome. A comparison of the GDP-bound conformation (pink) of EF-G with the GTP-bound conformation (red) reveals a shift at the tip of domain IV of the factor by ~25 Å. The presence of GTP also reveals an ordered Switch I loop and a different conformation of the Switch II loop. Altogether, these rearrangements likely are the basis of a much higher affinity of the pre-translocational ribosome for the GTP-bound conformation of EF-G. This figure was altered for the purposes of this article. Data adapted from Frank et al. (2007), copyright (2007) National Academy of Sciences.
Fig. 20
Fig. 20
Kinetic efficiency of the hybrid configuration. (a) Superimposition of aligned 30S subunits from hybrid (solid yellow), classic (transparent gray), and EF-G-bound (transparent purple) ribosomes. The binding position of EF-G (red) is shown for illustration purposes. (b) Close-up of the superimposition of hybrid (solid yellow) and EF-G-bound (transparent purple) ribosomes in the presence of EF-G•GDPNP and hybrid tRNAs. (c) Superimposed atomic models of 16S rRNA h44 for the classic state ribosome (blue), the hybrid state ribosome (yellow) and the EF-GGDPNP bound ribosome (red). The lower portion of h44 has been kept fixed in the fitting to show the displacement of the decoding region (top). The arrow points in the direction of the movement. A/A and P/P tRNAs are shown for clarity. This figure was altered for the purposes of this article. Data adapted from Agirrezabala et al. (2008), copyright (2008) Cell Press.
Fig. 21
Fig. 21
Head rotation of the small subunit. Superimposition of atomic models (obtained by real-space refinement) of the bodies of the small subunit of the pre-translocational (tan, PDB code: 1K5X) and the ratcheted, eEF2-bound (blue, PDB code: 1S1H) 80S ribosomes, by explicit least-squares fitting. Highlighted residues U955 and A1339 are in regions known to interact with ribosome-bound A- and P-site tRNAs, respectively. This figure was altered for the purposes of this article. Data adapted from Taylor et al. (2007), copyright (2007) Nature Publishing Group.
Fig. 22
Fig. 22
The A1338-790 ridge in the hybrid ribosome. The ASL of the hybrid P/E tRNA interacts with the small subunit head, near the G1338-U1341 ridge, as well as with the small subunit body, via the A790 loop of the 18S rRNA. Before the head of the small subunit rotates, the distance between A790 in the body and A1339 in the head of the small subunit is ~18 Å.
Fig. 23
Fig. 23
A model for EF-G based translocation. Once the incoming aa-tRNA is incorporated and the peptide transferred, the pre-translocational ribosomes starts fluctuating between (a) the classic (MSI) and (b) the hybrid tRNA configuration (MSII), a rearrangement coupled to the ratcheting of the small subunit. (c) The binding of EF-G stabilizes the ratcheted, MSII conformation of the ribosome. (d) Hydrolysis of GTP promotes the shift of domain IV of EF-G, which in turn detaches the mRNA–tRNA complex from the decoding center and allows rotation of the head. (e) The head rotation translocates the hybrid tRNAs to the P and E sites. (f) Translocation is completed by back-rotation of the head and reverse-ratcheting of the entire small subunit as EF-G in its GDP form is released from the ribosome.

Similar articles

Cited by

References

    1. Abel KM, Yoder MD, Hilgenfeld R, Jurnak F. An α to β conformational switch in EF-Tu. Structure. 1996;4:1153–1159. - PubMed
    1. Aevarsson A, Brazhnikov E, Garber M, Zheltonosava J, Chirgadze Y, Al-karadaghi S, Svensson LA, Liljas A. Three-dimensional structure of the ribosomal translocase: elongation factor G from Thermus thermophilus. EMBO Journal. 1994;13:3669–3677. - PMC - PubMed
    1. Agirrezabala X, Lei J, Brunelle JL, Ortiz-Meoz RF, Green R, Frank J. Visualization of the hybrid state of binding promoted by spontaneous ratcheting of the ribosome. Molecular Cell. 2008;32:190–197. - PMC - PubMed
    1. Agrawal RK, Penczek P, Grassucci RA, Frank J. Visualization of elongation factor G on the Escherichia coli 70S ribosome: the mechanism of translocation. Proceedings of the National Academy of Sciences USA. 1998;95:6134–6138. - PMC - PubMed
    1. Agrawal RK, Heagle AB, Penczek P, Grassucci R, Frank J. EF-G-dependent GTP hydrolysis induces translocation accompanied by large conformational changes in the 70S ribosome. Nature Structural Biology. 1999;6:643–647. - PubMed

Publication types

MeSH terms

LinkOut - more resources