

Cancer-testis antigens MAGE-C1/CT7 and MAGE-A3 promote the survival of multiple myeloma cells
- PMID: 20015885
- PMCID: PMC2864385
- DOI: 10.3324/haematol.2009.014464
Cancer-testis antigens MAGE-C1/CT7 and MAGE-A3 promote the survival of multiple myeloma cells
Abstract
Background: Multiple myeloma is a life-threatening disease and despite the introduction of stem cell transplantation and novel agents such as thalidomide, lenalidomide, and bortezomib most patients will relapse and develop chemoresistant disease. Therefore, alternative therapeutic modes for myeloma are needed and cancer-testis antigens such as MAGE-C1/CT7 and MAGE-A3 have been suggested to represent a class of tumor-specific proteins particularly suited for targeted immunotherapies. Surprisingly, the biological role of cancer-testis genes in myeloma remains poorly understood.
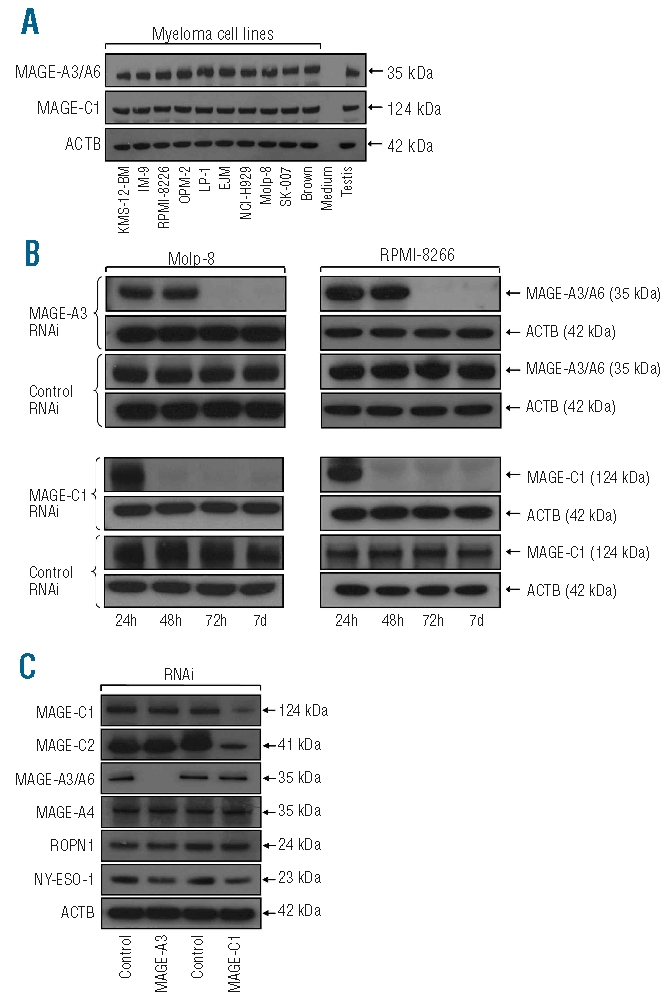
Design and methods: We performed the first investigation of the function of two cancer-testis antigens most commonly expressed in myeloma, MAGE-C1/CT7 and MAGE-A3, using an RNA interference-based gene silencing model in myeloma cell lines. Functional assays were used to determine changes in proliferation, cell adhesion, chemosensitivity, colony formation, and apoptosis resulting from gene-specific silencing.
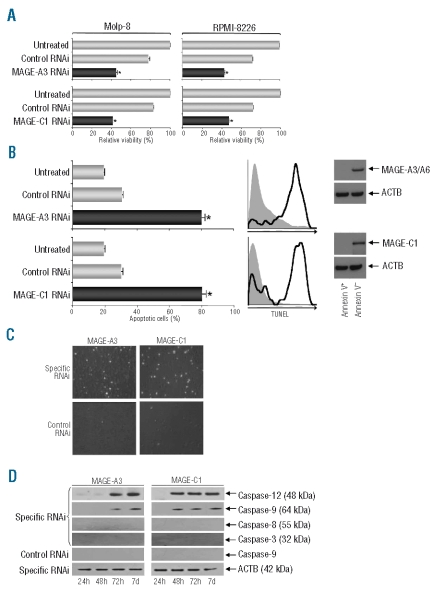
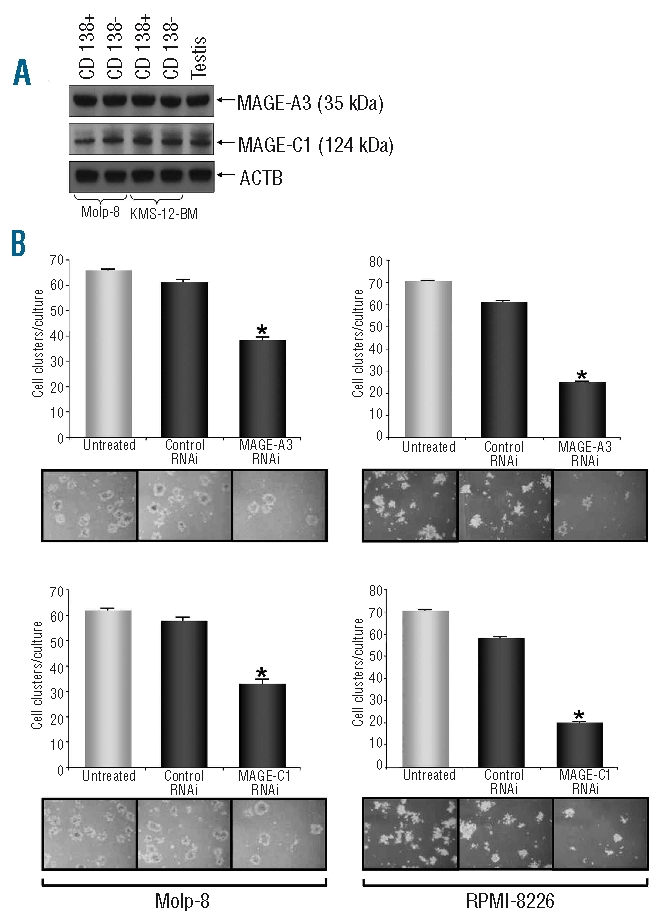
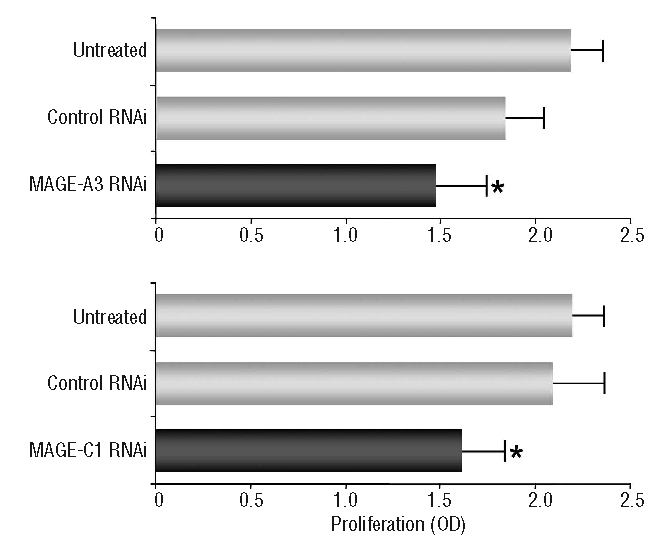
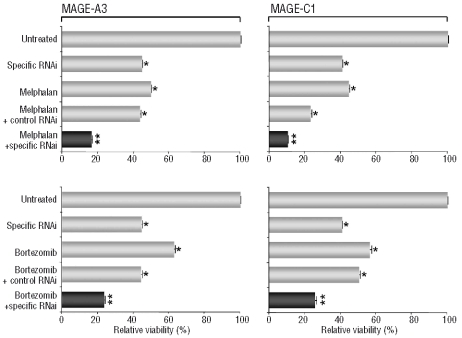
Results: We show that the investigated genes are not involved in regulating cell proliferation or adhesion; however, they play an important role in promoting the survival of myeloma cells. Accordingly, knock-down of MAGE-C1/CT7 and MAGE-A3 led to the induction of apoptosis in the malignant plasma cells and, importantly, both genes were also essential for the survival of clonogenic myeloma precursors. Finally, silencing of cancer-testis genes further improved the response of myeloma cells to conventional therapies.
Conclusions: Cancer-testis antigens such as MAGE-C1/CT7 and MAGE-A3 play an important role in promoting the survival of myeloma cells and clonogenic precursors by reducing the rate of spontaneous and chemotherapy-induced apoptosis and might, therefore, represent attractive targets for novel myeloma-specific therapies.
Figures
Comment in
-
Novel drugs for the treatment of multiple myeloma.Haematologica. 2010 May;95(5):702-4. doi: 10.3324/haematol.2009.021550. Haematologica. 2010. PMID: 20442442 Free PMC article. No abstract available.
Similar articles
-
Targeting MAGE-C1/CT7 expression increases cell sensitivity to the proteasome inhibitor bortezomib in multiple myeloma cell lines.PLoS One. 2011;6(11):e27707. doi: 10.1371/journal.pone.0027707. Epub 2011 Nov 16. PLoS One. 2011. PMID: 22110734 Free PMC article.
-
The cancer-testis antigens CT7 (MAGE-C1) and MAGE-A3/6 are commonly expressed in multiple myeloma and correlate with plasma-cell proliferation.Blood. 2005 Jul 1;106(1):167-74. doi: 10.1182/blood-2004-12-4931. Epub 2005 Mar 10. Blood. 2005. PMID: 15761016
-
Expression and prognostic relevance of MAGE-C1/CT7 and MAGE-C2/CT10 in osteolytic lesions of patients with multiple myeloma.Exp Mol Pathol. 2010 Oct;89(2):175-81. doi: 10.1016/j.yexmp.2010.06.011. Epub 2010 Jul 14. Exp Mol Pathol. 2010. PMID: 20621094
-
MAGE-C1/CT7 and MAGE-C2/CT10 are frequently expressed in multiple myeloma and can be explored in combined immunotherapy for this malignancy.Cancer Immunol Immunother. 2013 Jan;62(1):191-5. doi: 10.1007/s00262-012-1376-4. Epub 2012 Nov 22. Cancer Immunol Immunother. 2013. PMID: 23180015 Free PMC article.
-
Cancer/Testis Antigen MAGE-C1/CT7: new target for multiple myeloma therapy.Clin Dev Immunol. 2012;2012:257695. doi: 10.1155/2012/257695. Epub 2012 Mar 11. Clin Dev Immunol. 2012. PMID: 22481966 Free PMC article. Review.
Cited by
-
Melanoma Antigen Family A (MAGE A) as Promising Biomarkers and Therapeutic Targets in Bladder Cancer.Cancers (Basel). 2024 Jan 5;16(2):246. doi: 10.3390/cancers16020246. Cancers (Basel). 2024. PMID: 38254738 Free PMC article. Review.
-
Cancer-testis antigen expression and immunogenicity in AL amyloidosis.Blood Cancer J. 2012 Sep 14;2(9):e90. doi: 10.1038/bcj.2012.32. Blood Cancer J. 2012. PMID: 22983433 Free PMC article.
-
MAGEA6 positively regulates MSMO1 and promotes the migration and invasion of oesophageal cancer cells.Exp Ther Med. 2022 Mar;23(3):204. doi: 10.3892/etm.2022.11127. Epub 2022 Jan 7. Exp Ther Med. 2022. PMID: 35126707 Free PMC article.
-
An overview of cancer/testis antigens expression in classical Hodgkin's lymphoma (cHL) identifies MAGE-A family and MAGE-C1 as the most frequently expressed antigens in a set of Brazilian cHL patients.BMC Cancer. 2011 Sep 28;11(1):416. doi: 10.1186/1471-2407-11-416. BMC Cancer. 2011. PMID: 21951388 Free PMC article.
-
MAGE-A inhibits apoptosis in proliferating myeloma cells through repression of Bax and maintenance of survivin.Clin Cancer Res. 2011 Jul 1;17(13):4309-19. doi: 10.1158/1078-0432.CCR-10-1820. Epub 2011 May 12. Clin Cancer Res. 2011. PMID: 21565982 Free PMC article.
References
-
- Kyle RA, Rajkumar SV. Multiple myeloma. N Engl J Med. 2004;351(18):1860–73. - PubMed
-
- Simpson AJ, Caballero OL, Jungbluth A, Chen YT, Old LJ. Cancer/testis antigens, gametogenesis and cancer. Nat Rev Cancer. 2005;5(8):615–25. - PubMed
-
- Wischnewski F, Pantel K, Schwarzenbach H. Promoter demethylation and histone acetylation mediate gene expression of MAGE-A1, -A2, -A3, and -A12 in human cancer cells. Mol Cancer Res. 2006;4(5):339–49. - PubMed
-
- Chomez P, De Backer O, Bertrand M, De Plaen E, Boon T, Lucas S. An overview of the MAGE gene family with the identification of all human members of the family. Cancer Res. 2001;61(14):5544–51. - PubMed
Publication types
MeSH terms
Substances
LinkOut - more resources
Full Text Sources
Medical
