Original encounter with antigen determines antigen-presenting cell imprinting of the quality of the immune response in mice
- PMID: 19997562
- PMCID: PMC2785484
- DOI: 10.1371/journal.pone.0008159
Original encounter with antigen determines antigen-presenting cell imprinting of the quality of the immune response in mice
Abstract
Background: Obtaining a certain multi-functionality of cellular immunity for the control of infectious diseases is a burning question in immunology and in vaccine design. Early events, including antigen shuttling to secondary lymphoid organs and recruitment of innate immune cells for adaptive immune response, determine host responsiveness to antigens. However, the sequence of these events and their impact on the quality of the immune response remain to be elucidated. Here, we chose to study Modified Vaccinia virus Ankara (MVA) which is now replacing live Smallpox vaccines and is proposed as an attenuated vector for vaccination strategies against infectious diseases.
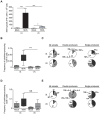
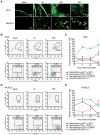
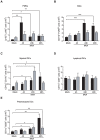
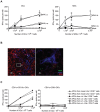
Methodology/principal findings: We analyzed in vivo mechanisms triggered following intradermal (i.d.) and intramuscular (i.m.) Modified Vaccinia virus Ankara (MVA) administration. We demonstrated significant differences in the antigen shuttling to lymphoid organs by macrophages (MPhis), myeloid dendritic cells (DCs), and neutrophils (PMNs). MVA i.d. administration resulted in better antigen distribution and more sustained antigen-presenting cells (APCs) recruitment into draining lymph nodes than with i.m. administration. These APCs, which comprise both DCs and MPhis, were differentially involved in T cell priming and shaped remarkably the quality of cytokine-producing virus-specific T cells according to the entry route of MVA.
Conclusions/significance: This study improves our understanding of the mechanisms of antigen delivery and their consequences on the quality of immune responses and provides new insights for vaccine development.
Conflict of interest statement
Figures

Similar articles
-
Vaccine Inoculation Route Modulates Early Immunity and Consequently Antigen-Specific Immune Response.Front Immunol. 2021 Apr 20;12:645210. doi: 10.3389/fimmu.2021.645210. eCollection 2021. Front Immunol. 2021. PMID: 33959127 Free PMC article.
-
Intrapulmonary (i.pulmon.) Pull Immunization With the Tuberculosis Subunit Vaccine Candidate H56/CAF01 After Intramuscular (i.m.) Priming Elicits a Distinct Innate Myeloid Response and Activation of Antigen-Presenting Cells Than i.m. or i.pulmon. Prime Immunization Alone.Front Immunol. 2020 May 7;11:803. doi: 10.3389/fimmu.2020.00803. eCollection 2020. Front Immunol. 2020. PMID: 32457748 Free PMC article.
-
Prime-boost immunization schedules based on influenza virus and vaccinia virus vectors potentiate cellular immune responses against human immunodeficiency virus Env protein systemically and in the genitorectal draining lymph nodes.J Virol. 2003 Jun;77(12):7048-57. doi: 10.1128/jvi.77.12.7048-7057.2003. J Virol. 2003. PMID: 12768024 Free PMC article.
-
Tailored immunity by skin antigen-presenting cells.Hum Vaccin Immunother. 2015;11(1):27-36. doi: 10.4161/hv.34299. Epub 2014 Nov 1. Hum Vaccin Immunother. 2015. PMID: 25483512 Free PMC article. Review.
-
The stromal and haematopoietic antigen-presenting cells that reside in secondary lymphoid organs.Nat Rev Immunol. 2010 Dec;10(12):813-25. doi: 10.1038/nri2886. Epub 2010 Nov 19. Nat Rev Immunol. 2010. PMID: 21088682 Review.
Cited by
-
Smallpox vaccines: targets of protective immunity.Immunol Rev. 2011 Jan;239(1):8-26. doi: 10.1111/j.1600-065X.2010.00975.x. Immunol Rev. 2011. PMID: 21198662 Free PMC article. Review.
-
Lymph-Derived Neutrophils Primarily Locate to the Subcapsular and Medullary Sinuses in Resting and Inflamed Lymph Nodes.Cells. 2021 Jun 12;10(6):1486. doi: 10.3390/cells10061486. Cells. 2021. PMID: 34204825 Free PMC article.
-
NFκB activation by modified vaccinia virus as a novel strategy to enhance neutrophil migration and HIV-specific T-cell responses.Proc Natl Acad Sci U S A. 2015 Mar 17;112(11):E1333-42. doi: 10.1073/pnas.1424341112. Epub 2015 Mar 4. Proc Natl Acad Sci U S A. 2015. PMID: 25739961 Free PMC article.
-
First Impressions Matter: Immune Imprinting and Antibody Cross-Reactivity in Influenza and SARS-CoV-2.Pathogens. 2023 Jan 21;12(2):169. doi: 10.3390/pathogens12020169. Pathogens. 2023. PMID: 36839441 Free PMC article. Review.
-
Study of camelpox virus pathogenesis in athymic nude mice.PLoS One. 2011;6(6):e21561. doi: 10.1371/journal.pone.0021561. Epub 2011 Jun 28. PLoS One. 2011. PMID: 21738709 Free PMC article.
References
-
- Earl PL, Americo JL, Wyatt LS, Eller LA, Whitbeck JC, et al. Immunogenicity of a highly attenuated MVA smallpox vaccine and protection against monkeypox. Nature. 2004;428:182–185. - PubMed
-
- Meseda CA, Garcia AD, Kumar A, Mayer AE, Manischewitz J, et al. Enhanced immunogenicity and protective effect conferred by vaccination with combinations of modified vaccinia virus Ankara and licensed smallpox vaccine Dryvax in a mouse model. Virology. 2005;339:164–175. - PubMed
Publication types
MeSH terms
Substances
LinkOut - more resources
Full Text Sources
Other Literature Sources
Miscellaneous

