. 2010 Jan 15;184(2):725-35.
doi: 10.4049/jimmunol.0902080. Epub 2009 Dec 7.

Antigen aggregation decides the fate of the allergic immune response

Affiliations

Antigen aggregation decides the fate of the allergic immune response

Nadja Zaborsky et al. J Immunol. .

Erratum in

Abstract

Previously, defined naturally occurring isoforms of allergenic proteins were classified as hypoallergens and therefore suggested as an agent for immunotherapy in the future. In this paper, we report for the first time the molecular background of hypoallergenicity by comparing the immunological behavior of hyperallergenic Betula verrucosa major Ag 1a (Bet v 1a) and hypoallergenic Bet v 1d, two isoforms of the major birch pollen allergen Betula verrucosa 1. Despite their cross-reactivity, Bet v 1a and Bet v 1d differ in their capacity to induce protective Ab responses in BALB/c mice. Both isoforms induced similar specific IgE levels, but only Bet v 1d expressed relevant titers of serum IgGs and IgAs. Interestingly, hypoallergenic Bet v 1d activated dendritic cells more efficiently, followed by the production of increased amounts of Th1- as well as Th2-type cytokines. Surprisingly, compared with Bet v 1a, Bet v 1d-immunized mice showed a decreased proliferation of regulatory T cells. Crystallographic studies and dynamic light scattering revealed that Bet v 1d demonstrated a high tendency to form disulfide-linked aggregates due to a serine to cysteine exchange at residue 113. We conclude that aggregation of Bet v 1d triggers the establishment of a protective Ab titer and supports a rationale for Bet v 1d being a promising candidate for specific immunotherapy of birch pollen allergy.


Figures
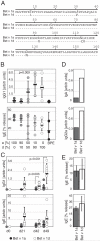
FIGURE 1
FIGURE 1
Specific Ab production toward Bet v 1a and d in mice. A, Sequence alignment of Bet v 1a and Bet v 1d. Different residues are indicated in bold. B, Mice were immunized with different mixtures of rBet v 1a and Bet v 1d or with BPE. The composition of each Bet v 1a/d mixture used for immunization is indicated. Specific IgG1 and IgE serum titers were determined by ELISA and β-hexosaminidase release assay at day 49, using an equimolar mixture of Bet v 1a/d as specific Ag. C, Mice were immunized with either Bet v 1a (dark gray circles) or Bet v 1d (○). Specific IgG1 and IgE serum titers were determined on days 0, 21, 42, and 49. (D) Specific IgA and IgG2a titers were determined from pooled sera of day 49 from mice described in C. E, Specific IgE titers from mice described in C were determined by β-hexosaminidase release assay on day 42 (upper panel) and day 49 (lower panel). Titers were determined from individual mice and mean values are shown as bars ± SD. BD, Each mouse is represented by a circle (n = 5 or 8/group), and pooled sera are shown as bars. Values are shown as arbitrary units in comparison with a pooled standard serum. Mean values are given as dash ± SD; values of p are indicated in graph (unpaired Student t test).
FIGURE 2
FIGURE 2
The sera from immunized mice are highly cross-reactive for Bet v 1a and Bet v 1d. Mice were immunized with either Bet v 1a (left panel) or Bet v 1d (right panel) as described in Fig. 1D, and specific serum IgG1 and IgE titers were analyzed for reactivity toward Bet v 1a (dark gray) or Bet v 1d (□) at day 49 postimmunization by ELISA and β-hexosaminidase release assay, respectively. Values are shown as arbitrary units in comparison with a standard serum. (n = 5/group).
FIGURE 3
FIGURE 3
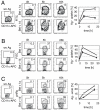
Ag uptake of BMDCs. A, BMDCs (BALB/c) were incubated with either FITC-labeled Bet v 1a or Bet v 1d and uptake of Ag was determined. A representative FACS profile of BMDCs is shown. Cells were pregated for live cells, and the percentage of Bet v 1a-FITC– or Bet v 1d-FITC–positive cells among the CD11c-positive population is indicated within each plot. B, BMDCs from C57BL/10ScNcr mice were incubated with FITC-labeled Bet v 1a or Bet v 1d and assayed as described in A. C, BMDCs from BALB/c mice were incubated with pHRodo-conjugated Bet v 1a or Bet v 1d, and internalization of specific Ag was monitored. Shown is the percentage of Bet v 1a (●)- and Bet v 1d (○)-positive cells at 0, 5, and 16 or 26 h postincubation with specific Ag (n = 5). Mean ± SD; values of p (unpaired Student t test) are indicated in graph.
FIGURE 4
FIGURE 4
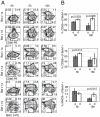
Expression of activation markers by BMDCs upon incubation with Bet v 1a and Bet v 1d. BMDCs were incubated with FITC-conjugated Bet v 1a or d. At different time points (t = 0, 5, and 16 h), cells were stained for CD80, CD86, or MHC II. Cells were gated for CD11c expression, and the amount of CD80, CD86, and MHC II expression was determined. A, A representative FACS profile of CD11c-positive cells. The percentage of cells within each quadrant is indicated. B, Statistical analysis of three independent experiments. Shown are the percentage of CD80 (upper graph)-, CD86 (middle graph)-, and MHC II (lower graph)-expressing cells within the Bet v 1a/d-FITC–positive BMDCs at 5 and 16 h postincubation with specific FITC-conjugated Ag. Mean ± SD; values of p are indicated in graph (unpaired Student t test).
FIGURE 5
FIGURE 5
IL-6 and IL-12/23 cytokine production by BMDCs upon incubation with Bet v 1a and Bet v 1d. BMDCs were incubated with FITC-conjugated Bet v 1a or d. After 26 h, cells were stained for intracellular IL-6 and IL-12/23 and anti-mouse CD11c Ab. Cells were gated for CD11c expression, and the amount of IL-6 and IL-12/23 production was determined. A, A representative FACS profile is shown. The percentage of cells within each quadrant is indicated. B, Statistical analysis of three independent experiments. Shown is the percentage of IL-6– and IL-12/23–expressing cells within the Bet v 1a/d-FITC–positive BMDCs at 26 h postincubation with specific Ag. Mean ± SD; values of p are indicated in graph (unpaired Student t test).
FIGURE 6
FIGURE 6
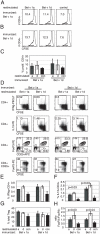
Different proliferation of specific Th1, Th2, and Tregs in coculture experiments with Bet v 1a- or Bet v 1d-pulsed BMDCs. A, BMDCs were incubated with specific Ag (Bet v 1a, left panel; Bet v 1d, middle panel; or no Ag, right panel) and were cocultered with CFSE-labeled syngeneic CD4+ T cells purified from Bet v 1a (A)- or Bet v 1d (B)-immunized mice. Proliferation of Bet v 1-specific T cells was determined after 3 d as decrease of CFSE intensity within the CD4-positive cell population as indicated in each histogram. Representative FACS profiles from four independent experiments are shown (C); statistical analysis of four independent experiments. D, BMDCs were incubated with specific Ag (restim. Bet v 1a or Bet v 1d) and were cocultered with CFSE-labeled syngeneic CD4+ T cells purified from Bet v 1a (left panel)- or Bet v 1d (right panel)-immunized mice (imm. Bet v 1a or Bet v 1d). After 3 d, proliferation of T cells was determined, and differentiation into Th cell subsets was analyzed using staining with specific Abs (Treg: CD4, CD25, FoxP3; Th1: IFN-γ; Th2: IL-13). Representative FACS profiles show the distribution and proliferation of the different Th subsets. E–H, Statistical analysis of experiments from D; H, ratio of proliferating CD4+ CD25+FoxP3 to CD4+CD25+FoxP3+ T cells is shown. Proliferating cells were defined as cells within the rectangular gates of FACS plots from bottom panel in D; n =6. Mean ± SD; values of p indicated in graph (Wilcoxon test).
FIGURE 7
FIGURE 7
Cytokine production of T cells primed by Bet v 1a- or Bet v 1d-pulsed BMDCs. Cell culture supernatants from coculture experiments described in Fig. 5 were analyzed for the presence of specific cytokines using CBA assays. Shown are absolute amounts of the respective cytokine (mean ± SD; n = 4). (Abbreviations used as in Fig. 5.)
FIGURE 8
FIGURE 8
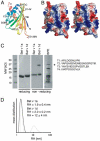
Crystal structure of Bet v1d. A, Ribbon diagram color-coded from N terminus (blue) to C terminus (red) showing residues that differ between isoforms Bet v 1a and Bet v 1d in sticks. B, Electrostatic surface potential map (blue positive, red negative) of Bet v 1a left and Bet v 1d right. C, Coomassie brilliant blue-stained reducing and nonreducing SDS-PAGE of Bet v 1a and d and aqueous BPE. Bands corresponding to dimerized Bet v 1 are marked with an asterisk. The band from BPE corresponding to dimeric Bet v 1 was analyzed by nanoliquid chromatography-tandem mass spectrometry–based sequencing. Four Bet v 1 derived peptides were identified (T1, A22–K33; T2, V34–K55; T3, Y82–K98; T4, I105–K116), with T1, T3, and T4 being specific for Bet v 1d. D, DLS of Bet v 1a (solid black line) versus Bet v 1d (dashed gray line) in RPMI 1640 at 37°C (RH, hydrodynamic radius).
FIGURE 9
FIGURE 9
Mutation of Cys113 of Bet v 1d abrogates dimerization and reverts Bet v 1d-specific immunological properties. A, Bet v 1a, Bet v 1d, and Bet v 1d[Cys113Ser] were loaded on a reducing or nonreducing SDS-PAGE. The asterisk marks dimeric Bet v 1d. B, Ag uptake by BMDCs. BMDCs were incubated with FITC-Bet v 1a, FITC-Bet v 1d, or FITC-Bet v 1d[Cys113Ser]. One representative FACS profile is shown. Statistical analysis is given as mean ± SD; values of p are indicated in graph (n = 6). C, Expression of activation markers by BMDCs. Cells were gated for CD11c expression and the amount of CD80 and MHC II surface expression was determined. The graph shows the percentage of CD80 and MHC II-expressing cells within the Bet v 1-FITC–positive BMDCs. Mean ± SD; values of p are indicated in graph (unpaired Student t test) n = 3. D, Specific Ab response in mice. Mice were immunized with either Bet v 1a (dark gray circles), Bet v 1d[Cys113Ser] (light gray circles) or Bet v 1d (○) and boosted 2 wk after primary immunization. Serum was taken at day 21, and specific IgG1 and IgE serum titers were determined (n = 7–10). Values are shown as arbitrary units in comparison with a pooled standard serum. Mean values are given as dash ± SD; values of p are indicated in graph (unpaired Student t test).
FIGURE 10
FIGURE 10
Illustration of the Ab response toward Bet v 1a (A) and Bet v1d (B). A, Monomeric Bet v 1a provides only low stimulus to APCs, leading to incomplete APC activation and therefore to a higher induction of Tregs with only moderate Ab levels. Because of the absence of a protective IgG/IgA Ab response, serum IgE levels are sufficient to trigger allergic symptoms. B, As a result of self-aggregation, Bet v 1d is more immunogenic reflected by the induction of higher costimulatory molecules, thereby inducing a strong Th1/Th2-dependent Ab response with high levels of protective IgG/IgA Abs for Ag clearance.

Similar articles

Cited by

References

    1. Galli SJ, Tsai M, Piliponsky AM. The development of allergic inflammation. Nature. 2008;454:445–454. - PMC - PubMed
    1. Wagner S, Radauer C, Bublin M, Hoffmann-Sommergruber K, Kopp T, Greisenegger EK, Vogel L, Vieths S, Scheiner O, Breiteneder H. Naturally occurring hypoallergenic Bet v 1 isoforms fail to induce IgE responses in individuals with birch pollen allergy. J. Allergy Clin. Immunol. 2008;121:246–252. - PubMed
    1. Schenk MF, Gilissen LJ, Esselink GD, Smulders MJ. Seven different genes encode a diverse mixture of isoforms of Bet v 1, the major birch pollen allergen. BMC Genomics. 2006;7:168. - PMC - PubMed
    1. Swoboda I, Jilek A, Ferreira F, Engel E, Hoffmann-Sommergruber K, Scheiner O, Kraft D, Breiteneder H, Pittenauer E, Schmid E, et al. Isoforms of Bet v 1, the major birch pollen allergen, analyzed by liquid chromatography, mass spectrometry, and cDNA cloning. J. Biol. Chem. 1995;270:2607–2613. - PubMed
    1. Ferreira F, Hirtenlehner K, Jilek A, Godnik-Cvar J, Breiteneder H, Grimm R, Hoffmann-Sommergruber K, Scheiner O, Kraft D, Breitenbach M, et al. Dissection of immunoglobulin E and T lymphocyte reactivity of isoforms of the major birch pollen allergen Bet v 1: potential use of hypoallergenic isoforms for immunotherapy. J. Exp. Med. 1996;183:599–609. - PMC - PubMed

Publication types

Associated data