Maize inbreds exhibit high levels of copy number variation (CNV) and presence/absence variation (PAV) in genome content
- PMID: 19956538
- PMCID: PMC2780416
- DOI: 10.1371/journal.pgen.1000734
Maize inbreds exhibit high levels of copy number variation (CNV) and presence/absence variation (PAV) in genome content
Abstract
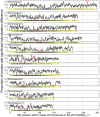
Following the domestication of maize over the past approximately 10,000 years, breeders have exploited the extensive genetic diversity of this species to mold its phenotype to meet human needs. The extent of structural variation, including copy number variation (CNV) and presence/absence variation (PAV), which are thought to contribute to the extraordinary phenotypic diversity and plasticity of this important crop, have not been elucidated. Whole-genome, array-based, comparative genomic hybridization (CGH) revealed a level of structural diversity between the inbred lines B73 and Mo17 that is unprecedented among higher eukaryotes. A detailed analysis of altered segments of DNA conservatively estimates that there are several hundred CNV sequences among the two genotypes, as well as several thousand PAV sequences that are present in B73 but not Mo17. Haplotype-specific PAVs contain hundreds of single-copy, expressed genes that may contribute to heterosis and to the extraordinary phenotypic diversity of this important crop.
Conflict of interest statement
Todd Richmond, Jacob Kitzman, Heidi Rosenbaum, A. Leonardo Iniguez, and Jeffrey A. Jeddeloh are employees of Roche NimbleGen.
Figures


Similar articles
-
Pervasive gene content variation and copy number variation in maize and its undomesticated progenitor.Genome Res. 2010 Dec;20(12):1689-99. doi: 10.1101/gr.109165.110. Epub 2010 Oct 29. Genome Res. 2010. PMID: 21036921 Free PMC article.
-
Sequence analysis of European maize inbred line F2 provides new insights into molecular and chromosomal characteristics of presence/absence variants.BMC Genomics. 2018 Feb 5;19(1):119. doi: 10.1186/s12864-018-4490-7. BMC Genomics. 2018. PMID: 29402214 Free PMC article.
-
Allelic genome structural variations in maize detected by array comparative genome hybridization.Theor Appl Genet. 2010 Jan;120(2):355-67. doi: 10.1007/s00122-009-1128-9. Epub 2009 Aug 19. Theor Appl Genet. 2010. PMID: 19756477
-
Genomic screening for artificial selection during domestication and improvement in maize.Ann Bot. 2007 Nov;100(5):967-73. doi: 10.1093/aob/mcm173. Epub 2007 Aug 18. Ann Bot. 2007. PMID: 17704539 Free PMC article. Review.
-
The Past, Present, and Future of Maize Improvement: Domestication, Genomics, and Functional Genomic Routes toward Crop Enhancement.Plant Commun. 2019 Nov 27;1(1):100010. doi: 10.1016/j.xplc.2019.100010. eCollection 2020 Jan 13. Plant Commun. 2019. PMID: 33404535 Free PMC article. Review.
Cited by
-
Copy Number Variation among Resistance Genes Analogues in Brassica napus.Genes (Basel). 2022 Nov 4;13(11):2037. doi: 10.3390/genes13112037. Genes (Basel). 2022. PMID: 36360273 Free PMC article.
-
Whole-genome sequencing and genetic variant analysis of a Quarter Horse mare.BMC Genomics. 2012 Feb 17;13:78. doi: 10.1186/1471-2164-13-78. BMC Genomics. 2012. PMID: 22340285 Free PMC article.
-
Reliable transient transformation of intact maize leaf cells for functional genomics and experimental study.Plant Physiol. 2012 Aug;159(4):1309-18. doi: 10.1104/pp.112.199737. Epub 2012 Jun 15. Plant Physiol. 2012. PMID: 22706447 Free PMC article.
-
Mutator-Based Transposon Display: A Genetic Tool for Evolutionary and Crop-Improvement Studies in Maize.Mol Biotechnol. 2018 Nov;60(11):799-809. doi: 10.1007/s12033-018-0118-z. Mol Biotechnol. 2018. PMID: 30178297
-
FrangiPANe, a tool for creating a panreference using left behind reads.NAR Genom Bioinform. 2023 Feb 20;5(1):lqad013. doi: 10.1093/nargab/lqad013. eCollection 2023 Mar. NAR Genom Bioinform. 2023. PMID: 36814455 Free PMC article.
References
-
- Feuk L, Carson AR, Scherer SW. Structural variation in the human genome. Nat Rev Genet. 2006;7:85–97. - PubMed
-
- Sharp AJ, Hansen S, Selzer RR, Cheng Z, Regan R, et al. Discovery of previously unidentified genomic disorders from the duplication architecture of the human genome. Nat Genet. 2006;38:1038–1042. - PubMed
-
- Beckmann JS, Estivill X, Antonarakis SE. Copy number variants and genetic traits: Closer to the resolution of phenotypic to genotypic variability. Nat Rev Genet. 2007;8:639–646. - PubMed
-
- Cooper GM, Nickerson DA, Eichler EE. Mutational and selective effects on copy-number variants in the human genome. Nat Genet. 2007;39:S22–9. - PubMed
Publication types
MeSH terms
LinkOut - more resources
Full Text Sources
Other Literature Sources
Molecular Biology Databases
Miscellaneous

