. 2009 Nov 26;462(7272):473-9.
doi: 10.1038/nature08542.

Structure and hydration of membranes embedded with voltage-sensing domains

Affiliations

Structure and hydration of membranes embedded with voltage-sensing domains

Dmitriy Krepkiy et al. Nature. .

Abstract

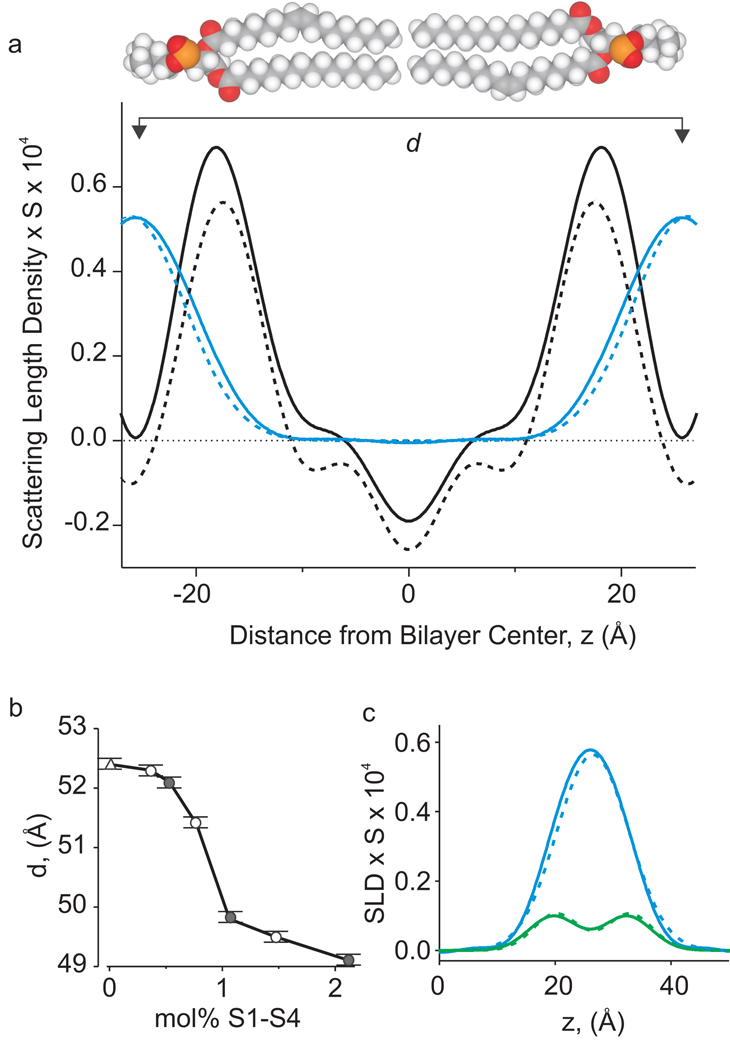
Despite the growing number of atomic-resolution membrane protein structures, direct structural information about proteins in their native membrane environment is scarce. This problem is particularly relevant in the case of the highly charged S1-S4 voltage-sensing domains responsible for nerve impulses, where interactions with the lipid bilayer are critical for the function of voltage-activated ion channels. Here we use neutron diffraction, solid-state nuclear magnetic resonance (NMR) spectroscopy and molecular dynamics simulations to investigate the structure and hydration of bilayer membranes containing S1-S4 voltage-sensing domains. Our results show that voltage sensors adopt transmembrane orientations and cause a modest reshaping of the surrounding lipid bilayer, and that water molecules intimately interact with the protein within the membrane. These structural findings indicate that voltage sensors have evolved to interact with the lipid membrane while keeping energetic and structural perturbations to a minimum, and that water penetrates the membrane, to hydrate charged residues and shape the transmembrane electric field.


Figures

Figure 1
Figure 1. S1–S4 voltage-sensing domains and their biophysical properties in lipid bilayers
a) Representation of membrane proteins containing S1–S4 voltage-sensing domains (red), embedded in the lipid bilayer (light grey). b) Circular Dichroism spectra of the S1–S4 voltage-sensing domain of KvAP in OG micelles (dotted red line) or reconstituted into POPC:POPG proteoliposomes at a protein/lipid molar ratio of 1:130 (solid red line). Mean residue elipticity (Θ) is given in units of deg cm2 dmol−1. CD spectra indicate high (~85 %) helical content (see Methods). c) Fluorescence emission spectra of Trp70 within the S1–S4 voltage-sensing domain after reconstitution in POPC:POPG (protein/lipid molar ratio of 1:100) in the absence (solid red line) and presence of 50 mM aqueous acrylamide (dotted red line). Emission spectra for the free Trp (25 µM) mixed with the POPC:POPG liposomes of identical lipid concentration in the absence (solid green line) and presence of 50 mM aqueous acrylamide (dotted green line). d) Stern-Volmer plots for acrylamide quenching of fluorescence emission for Trp70 within the S1–S4 voltage-sensing domain (red) or free Trp (green). Error bars are S.E.M (n=3). The Stern-Volmer constant for quenching was 0.4±0.02 M−1 for Trp70 and 26.2±0.2 M−1 for free Trp. e) Quenching of fluorescence emission of Trp70 within the S1–S4 voltage-sensing domain by Br atoms attached at different positions along the lipid hydrocarbon tail. The protein was reconstituted into the 1:1 mixture of POPG and either POPC or one of three dibrominated lipids (Br2(6,7)-PC, Br2(9,10)-PC, Br2(11,12)-PC (see Methods for nomenclature). Error bars are S.E.M (n=3).
Figure 2
Figure 2. Scattering length density profiles for bilayers containing S1-S4 voltage-sensing domains
a) Scattering-length density profiles on an absolute scale of the S1–S4 voltage-sensing domain in lipid bilayers (black solid line) and the water distribution (blue solid line). Protein:lipid ratio is 1:130 (0.77 mol%) and relative humidity is 86%. Profiles for lipid in the absence of protein (dashed lines) are shown for comparison. The density profile amplitudes are presented in units of scattering-length per unit length, corresponding to the scattering-length density of a unit cell (0.4962:0.4962:0.0079 POPC:POPG:protein, plus 8.5 water molecules) multiplied by the area per lipid (S) (see Methods). The X axis shows the distance from the bilayer center (z) with 0 positioned in the middle of the bilayer. b) Effect of S1–S4 voltage sensing domains on the bilayer thickness (Bragg spacing, d) at different protein:lipid ratios (given as mol% protein). Triangle marks the value of d for neat lipid bilayers. Open circles are for voltage-sensing domains with His tag removed (see methods) and closed circles are for the His-tagged protein. c) Distribution of deuterium atoms in headgroup labeled phosphocholine (–C2H2-C2H2-; D4 lipid) in bilayers containing S1–S4 domains (solid green line) and comparison to the distribution of water (solid blue line). Dashed lines show distribution of D4 lipid and water in the absence of the protein. Protein:lipid ratio is as in b and 25 mol% D4-POPC is used in the mixture of POPC:POPG. Relative humidity is 93%.
Figure 3
Figure 3. Deuteration of S1–S4 voltage-sensing domains and distribution of the protein in lipid membranes
a) Mass spectra (MS-MALDI) of the protonated S1–S4 domain of KvAP (1H S1–S4; purple) and uniformly deuterated S1–S4 domain (2H S1–S4; red). The difference in mass indicates that the protein is deuterated to 74%. b) Transbilayer distribution of the S1–S4 domain (white line surrounded by a broad red band) obtained in neutron diffraction experiments by the profile difference of deuterated and protonated S1–S4 domains. Profiles are shown on an absolute (per lipid) scale. Water distribution is shown in blue and lipid as a black line surrounded by a gray band. The broad bands represent estimates of experimental uncertainty computed using the methods of Wiener and White. Protein:lipid ratio is 1:130 (0.77 mol%) and relative humidity is 93%. c) Neutron scattering length density profiles for the simulation system with 11 water molecules per lipid. Transbilayer distribution of the S1–S4 domain is shown as a white line surrounded by a broad red band (estimated experimental uncertainty), water in blue and lipid in black. d) Snapshots of the region in the vicinity of one of the two voltage-sensing domains from the MD simulation of a stack of two bilayers with 11 water molecules per lipid (left) and excess water (right). Waters within 6 Å of protein are shown as red/white spheres while all other waters are colored purple. Phosphocholine headgroups are colored yellow and the acyl chains are colored light green. Ribbon diagram of the S1–S4 domain is colored red with the outer four arginines in S4 shown as blue CPK models.
Figure 4
Figure 4. Interaction of water and S1–S4 voltage-sensing domains within lipid membranes
a) Schematic representation of crevices in S1–S4 voltage-sensing domains (red) filled with water (blue) and an experiment in which selective, saturating radio frequency (RF) pulses were applied at the water resonance (4.792 ppm). Magnetization transfer from water through protein to the surrounding lipid results in the attenuation of the lipid 1H NMR signals. b) Aliphatic region of MAS 1H NMR spectra of a lipid sample containing S1–S4 voltage-sensing domains in the presence of 1H2O (left spectrum) or 2H2O (right spectrum). Lipid resonances for both POPC and POPG (present in a 1:1 mix) are indicated on the spectra, with peaks corresponding to underlined 1H atoms. Attenuation of the methylene resonance (1.3 ppm) is observed (blue traces) when saturating RF pulses (field strength 232 Hz) are applied at 4.792 ppm to a sample containing 1H2O (left spectrum), but not to one containing 2H2O (right spectrum). Attenuation is defined as signal intensity recorded without saturation divided by signal intensity with saturation. c) Attenuation factors plotted as a function of RF field strength (power, kHz). The carrier frequency was placed on either the water resonance (4.792 ppm) (blue) or protein amide region 8.5 ppm (red). All circles are for S1–S4 domains in lipid bilayers where protein: lipid ratio is 1:100. Triangles are for samples containing lipid alone. Samples containing 1H2O are shown as filled symbols, whereas those in 2H2O are shown as open symbols.
Figure 5
Figure 5. Effects of the voltage-sensing domain on a lipid bilayer as revealed by molecular dynamics simulation
a) The lipid bilayer interface, represented as a 2D Delaunay triangulation for the average positions of lipid carbonyl carbon atoms, reveals local distortions around the voltage-sensing domain. b) The transmembrane potential on a slice passing through the system center (the R133-D62 salt-bridge) shows focusing features in the voltage-sensing domain cavities. Contributions to the molecular surface by aliphatic chains (green); polar groups (yellow); and protein (white, transparent) of the corresponding cutaway view are shown as background. The dashed box indicates the region of the system considered atomistic in the calculation of the transmembrane potential (see Methods). In both panels the voltage-sensing domain is in ribbon representation with the outer four arginines in S4, and their salt-bridge partners, shown in CPK representation and colored by atom.

Comment in

Similar articles

Cited by

References

    1. Swartz KJ. Sensing voltage across lipid membranes. Nature. 2008;456:891–897. - PMC - PubMed
    1. Murata Y, Iwasaki H, Sasaki M, Inaba K, Okamura Y. Phosphoinositide phosphatase activity coupled to an intrinsic voltage sensor. Nature. 2005;435:1239–1243. - PubMed
    1. Lee SY, Letts JA, MacKinnon R. Functional reconstitution of purified human Hv1 H+ channels. J Mol Biol. 2009;387:1055–1060. - PMC - PubMed
    1. Jiang Y, et al. X-ray structure of a voltage-dependent K+ channel. Nature. 2003;423:33–41. - PubMed
    1. Long SB, Tao X, Campbell EB, MacKinnon R. Atomic structure of a voltage-dependent K+ channel in a lipid membrane-like environment. Nature. 2007;450:376–382. - PubMed

Publication types

MeSH terms