. 2010 Feb;30(3):657-74.
doi: 10.1128/MCB.01117-09. Epub 2009 Nov 23.

Fission yeast Iec1-ino80-mediated nucleosome eviction regulates nucleotide and phosphate metabolism

Affiliations

Fission yeast Iec1-ino80-mediated nucleosome eviction regulates nucleotide and phosphate metabolism

Cassandra Justine Hogan et al. Mol Cell Biol. 2010 Feb.

Abstract

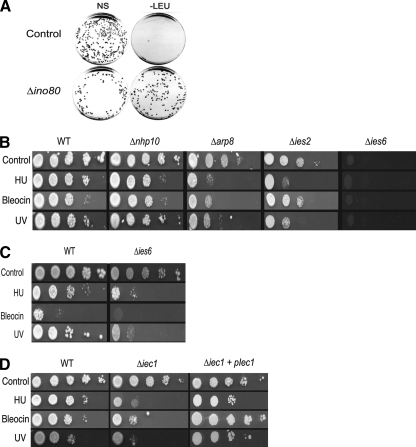
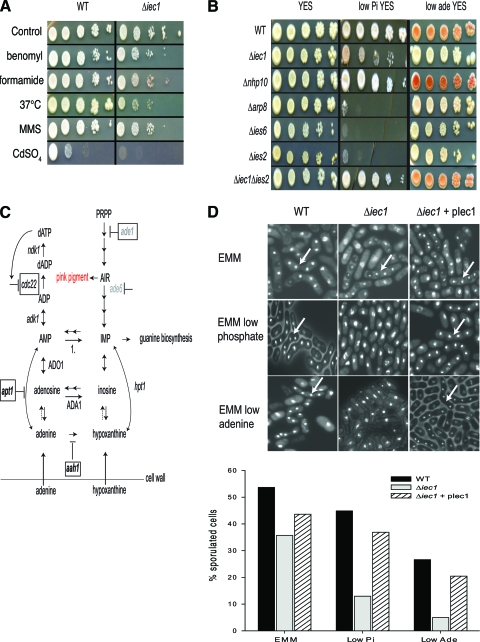
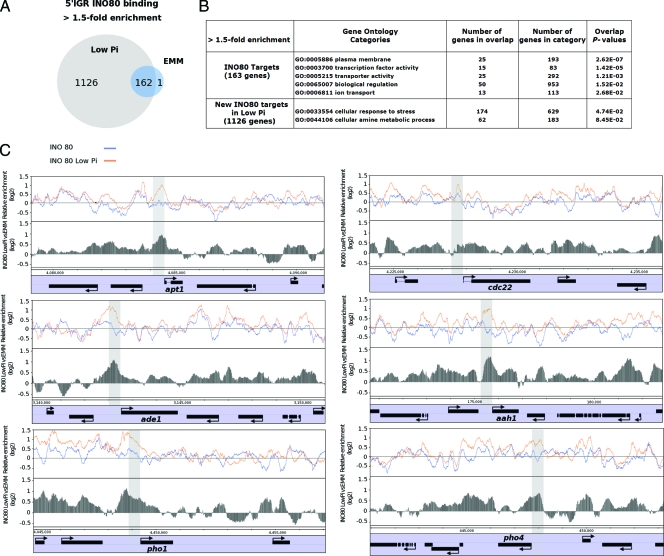
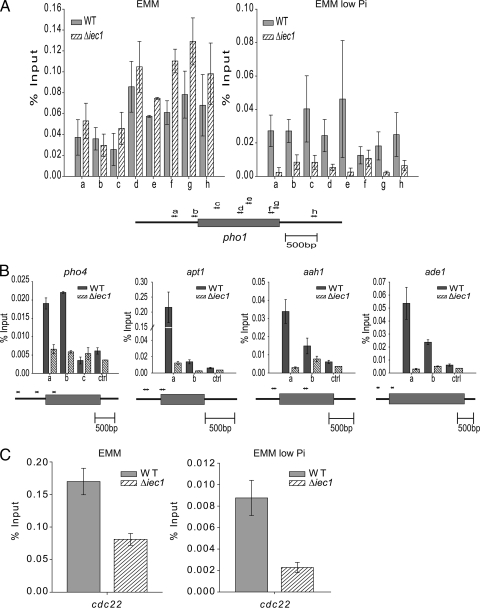
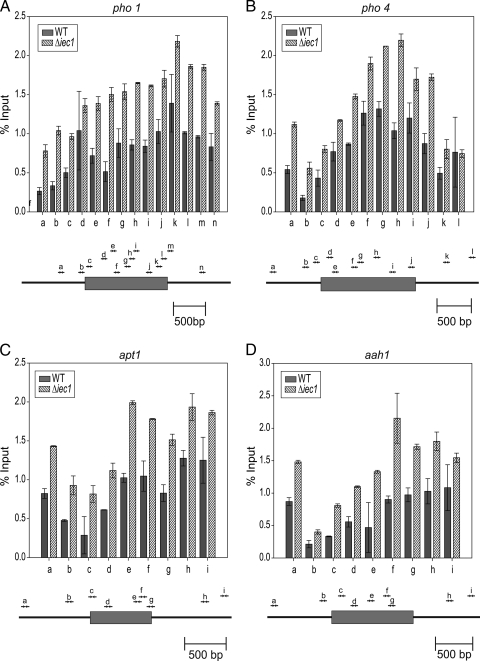
Ino80 is an ATP-dependent nucleosome-remodeling enzyme involved in transcription, replication, and the DNA damage response. Here, we characterize the fission yeast Ino80 and find that it is essential for cell viability. We show that the Ino80 complex from fission yeast mediates ATP-dependent nucleosome remodeling in vitro. The purification of the Ino80-associated complex identified a highly conserved complex and the presence of a novel zinc finger protein with similarities to the mammalian transcriptional regulator Yin Yang 1 (YY1) and other members of the GLI-Krüppel family of proteins. Deletion of this Iec1 protein or the Ino80 complex subunit arp8, ies6, or ies2 causes defects in DNA damage repair, the response to replication stress, and nucleotide metabolism. We show that Iec1 is important for the correct expression of genes involved in nucleotide metabolism, including the ribonucleotide reductase subunit cdc22 and phosphate- and adenine-responsive genes. We find that Ino80 is recruited to a large number of promoter regions on phosphate starvation, including those of phosphate- and adenine-responsive genes that depend on Iec1 for correct expression. Iec1 is required for the binding of Ino80 to target genes and subsequent histone loss at the promoter and throughout the body of these genes on phosphate starvation. This suggests that the Iec1-Ino80 complex promotes transcription through nucleosome eviction.


Figures

FIG. 1.
FIG. 1.
Iec1 is a component of the fission yeast Ino80 complex. (A) Fractions from mock purification or Ino80 FLAG affinity purification were separated by SDS-acrylamide gel electrophoresis and stained with silver. Corresponding bands were excised and analyzed by mass spectrometry. Shown on the left are approximate protein molecular masses (kDa) and on the right the running positions of identified Ino80 complex components. (B) The fission yeast Ino80 complex remodels nucleosomes in vitro. Recombinant nucleosome arrays (0.5 μg) were incubated with Ino80 complex (containing ∼70 fmol Arp8) or mock fractions and restriction endonuclease DraI in the presence (+) or absence (−) of ATP. The DNA was then purified, separated by agarose gel electrophoresis, and stained with ethidium bromide. Shown on the left are running positions of DNA size markers (bp); the arrows point to DNA fragments that were cleaved more readily in the presence of Ino80. (C) Schematic representations of Iec1, YY1, PHO, and GLI3. The ovals denote zinc finger domains, and the white circles are the conserved HTGEKPF motif. aa, amino acids. (D) Amino acid sequence of Iec1. Cysteines and histidines likely to be involved in forming zinc fingers are indicated in red, and the conserved HTGEKPF motif is shaded in yellow. (E) Immunoprecipitation using anti-MYC antibody from 5-ml whole-cell extracts of FLAG-tagged Ino80/MYC-tagged Iec1- (a), FLAG-tagged Ino80/HA-tagged Iec1- (b), and nontagged Ino80/HA-tagged Iec1-expressing cells (c) showed that Ino80 coimmunoprecipitated with Iec1. Lanes 1, 4, and 7 correspond to 1.5 μl crude extract; lanes 2, 5, and 8 correspond to 1 μl extract; and lanes 3, 6, and 9 correspond to 0.5 μl extract. Lane 11 corresponds to 13% of the immunoprecipitation eluate from the extract of FLAG-tagged Ino80/MYC-tagged Iec1-expressing cells, lane 13 shows the corresponding control eluate from the extract of HA-tagged Ino80/MYC-tagged Iec1-expressing cells, and lanes 10 and 12 are blank. The immunocomplexes were subjected to immunoblot analysis with the indicated antibodies. The Western blot also shows that Ino80-FLAG was specifically detected, because there was no band when Ino80 was not FLAG tagged (lanes 7 to 9). (F) Immunoblot analysis of an anti-FLAG antibody immunoprecipitation experiment from whole-cell extracts of HA-Iec1/FLAG-Ino80-expressing cells. The control immunoprecipitation was done with extracts from cells expressing HA-Iec1 and nontagged Ino80. Lanes 1, 2, 7, and 8 show the inputs (1-μl extracts; 0.0002% of the total input); lanes 3 and 4 show the anti-FLAG blots from 0.2 and 0.1 μl of immunoprecipitates from HA-Iec1/FLAG-Ino80-containing extracts (total eluate, 200 μl); and lanes 5 and 6 show the corresponding controls. Lanes 9 and 10 show the anti-HA blots from 3 and 1 μl of immunoprecipitates from HA-Iec1/FLAG-Ino80-containing extracts, and lanes 11 and 12 show the corresponding controls.
FIG. 2.
FIG. 2.
Ino80 complex subunits are required for viability and the response to DNA damage and replication stress. (A) Plasmid loss assay demonstrating the essential role of ino80 in fission yeast. ino80 null cells complemented with a plasmid expressing Ino80 in trans (SA003) retained the plasmid for survival, whereas the control cells with empty vector (SA002) lost the plasmid and became auxotrophic for leucine. NS, nonselective medium containing leucine. (B) Tenfold serial dilutions of a control strain (WT; FY367), nhp10 null mutants (Δnhp10; CH010), arp8 null mutants (Δarp8; CH011), ies2 null mutants (Δies2; CH012), and ies6 null mutants (Δies6; CH013) were plated on minimal medium (EMM) containing 7.5 mM HU or 3 μg/ml bleocin or were exposed to 100 J/m2 UV light (UV), incubated at 30°C, and visualized after 5 days. (C) Δies6 cells were plated on rich medium (YES) and exposed to the same conditions as in panel B. (D) Tenfold serial dilutions of a control strain with empty vector (WT; CH008), an iec1 null mutant with empty vector (Δiec1; CH009), and an iec1 null mutant with vector containing full-length Iec1 (ΔIec1+pIec1; CH007) were plated as in panel B.
FIG. 3.
FIG. 3.
Fission yeast strains lacking iec1 and Ino80 complex subunits are sensitive to various stress conditions, including phosphate and adenine limitation. (A) Tenfold serial dilutions of control (WT; FY367) and Δiec1 (CH015) were plated on rich medium (YES) and incubated at 37°C or supplemented with 10 μg/ml benomyl, 1% formamide, 0.004% MMS, or 0.5 mM CdSO4; incubated at 30°C; and visualized after 3 to 4 days. (B) Dilutions of control (WT; SA001), Δiec1 (CH003), Δnhp10 (CH010), Δarp8 (CH011), Δies6 (CH013), and Δies2 (CH012) cells and iec1 ies2 double-deleted (Δiec1Δies2; CH014) cells were plated onto YES, phosphate-depleted YES, and low-adenine YES; incubated at 30°C; and visualized after 3 to 4 days. (C) Schematic of the de novo and salvage pathways of adenine biosynthesis (72). The fission yeast enzymes are in lowercase italics, and the human and budding yeast genes are in uppercase. ade1, adenylate deaminase; gray, de novo synthesis pathway; boxed, enzymes in the pathway found to be affected by the deletion of iec1 in this study. (D) (Top) Control cells with empty vector (WT; CH008), Δiec1 cells with empty vector (CH009), and Δiec1 plus pIec1 cells (CH007, expressing full-length Iec1 in trans) were grown in EMM, low-phosphate EMM, and low-adenine EMM; stained with DAPI; and visualized by light microscopy. Asci containing 4 spores can be seen in EMM, but not low-phosphate EMM or low-adenine EMM, in the Δiec1 cells (arrows). (Bottom) Diagram showing the percentages of asci within the cell populations depicted in the images above.
FIG. 4.
FIG. 4.
Iec1 is required for correct pho1, pho4, apt1, and cdc22 expression. (A) (Top) Northern analysis of pho1 transcript levels in control (WT; SA001) and Δiec1 (CH003) cells. The cells were grown in minimal and low-phosphate minimal media, and pho1 transcript levels were assayed. (Bottom) Quantification of pho1 transcript levels by PCR following reverse transcription. The values were normalized to actin and expressed as fold change in expression relative to the control (WT). The error bars represent the standard errors of two independent experiments. (B) Northern analysis of pho4 and apt1 transcript levels in control (SA001) and Δiec1 (CH003) cells. The cells were grown in low-phosphate minimal or low-phosphate rich medium, and pho4 and apt1 transcript levels were quantified. Below is a graphic representation of the values normalized to 25S rRNA from the blots above and expressed as fold change relative to the control (WT). The error bars represent the standard errors of two independent experiments. No change in the expression level of these genes was observed when cells were grown in minimal medium containing normal levels of phosphate. (C) The expression of iec1 in WT cells grown in minimal medium (EMM) and low-phosphate minimal medium (low Pi) was quantified by PCR following reverse transcription of RNA. The results were normalized to actin and expressed as fold change relative to WT expression in EMM. The error bars represent the standard deviations of two independent experiments. (D) Northern analysis of cdc22 expression levels in control (SA001) and Δiec1 (CH003) cells. The cells were grown in minimal or low-phosphate minimal medium, and cdc22 transcript levels were quantified. Below is a graphic representation of the values normalized to actin and expressed as fold change relative to the control (WT). The error bars represent the standard errors of two independent experiments. (E) dNTP levels were assayed in control (SA001) and Δiec1 (CH003) cells grown in EMM as described in Materials and Methods and expressed as a percentage of the total nucleotide pool. The error bars represent the standard errors of three independent experiments.
FIG. 5.
FIG. 5.
Ino80 is recruited to the apt1, cdc22, ade1, aah1, pho1, and pho4 promoter regions upon phosphate starvation. (A) Venn diagram illustrating the number of promoter regions showing significant Ino80 binding in EMM and low-phosphate EMM. (B) Results of gene ontology analysis of Ino80 target genes. The most significant gene ontology categories, the number of genes in overlap, the number of genes in each category, and the P values indicating the significance of the overlap are shown. (C) High-resolution tiling arrays showing the enrichment of Ino80-FLAG in cells growing in low-phosphate EMM compared to normal EMM for the apt1, cdc22, ade1, aah1, pho1, and pho4 genes.
FIG. 6.
FIG. 6.
Iec1 mediates binding of Ino80 to target genes. Ino80 occupancy of Ino80p in control (WT; SA001) and Δiec1 (CH003) strains was determined by ChIP at the pho1 locus (A) and at the pho4, apt1, aah1 and ade1 loci (B) in low-phosphate media. Schematic representations of the loci show the localization of the primer pairs used for quantitative PCR indicated by horizontal arrows. The control locus (ctrl) is 800 bp upstream of the ade10 open reading frame. (C) Ino80 occupancy of Ino80p in control (SA001) and Δiec1 (CH003) strains was determined at a site 800 bp upstream of the cdc22 ORF in minimal and low-phosphate media. The error bars represent the standard errors of two independent experiments. Gray bars, control strain; hatched bars, Δiec1 strain.
FIG. 7.
FIG. 7.
Iec1 is recruited to genes involved in nucleotide metabolism. ChIP of a MYC-tagged Iec1p strain (CH016) grown in low-phosphate EMM was performed at the pho1, pho4, apt1, and aah1 loci. The results were normalized to no-antibody control and expressed as a percentage of the input. Anti-MYC ChIP of a nontagged strain was plotted to show background enrichment (ctrl). The error bars represent the standard errors of two independent experiments. Black bars, 13MYC Iec1 strain; white bars, control strain. Below each diagram is a schematic representation of the locus with the localization of the primer pairs used for quantitative PCR indicated by horizontal arrows.
FIG. 8.
FIG. 8.
Iec1 mediates nucleosome eviction at promoters and in the bodies of target genes. (A to D) Chromatin immunoprecipitation of histone H3 in control (WT; SA001) and Δiec1 (CH003) strains grown in low-phosphate EMM was performed at the pho1, pho4, apt1, and aah1 loci. The error bars represent the standard errors of two independent experiments. Black bars, control; hatched bars, Δiec1. The diagrams show a schematic representation of each locus with the localization of primer pairs used for quantitative PCR indicated by horizontal arrows.

Similar articles

Cited by

References

    1. Affar, E. B., F. Gay, Y. Shi, H. Liu, M. Huarte, S. Wu, T. Collins, E. Li, and Y. Shi. 2006. Essential dosage-dependent functions of the transcription factor yin yang 1 in late embryonic development and cell cycle progression. Mol. Cell. Biol. 26:3565-3581. - PMC - PubMed
    1. Altschul, S. F., and E. V. Koonin. 1998. Iterated profile searches with PSI-BLAST—a tool for discovery in protein databases. Trends Biochem. Sci. 23:444-447. - PubMed
    1. Bähler, J., J. Q. Wu, M. S. Longtine, N. G. Shah, A. McKenzie, A. B. Steever, A. Wach, P. Philippsen, and J. R. Pringle. 1998. Heterologous modules for efficient and versatile PCR-based gene targeting in Schizosaccharomyces pombe. Yeast 14:943-951. - PubMed
    1. Bao, Y., and X. Shen. 2007. INO80 subfamily of chromatin remodeling complexes. Mutat. Res. 618:18-29. - PMC - PubMed
    1. Barbaric, S., T. Luckenbach, A. Schmid, D. Blaschke, W. Horz, and P. Korber. 2007. Redundancy of chromatin remodeling pathways for the induction of the yeast PHO5 promoter in vivo. J. Biol. Chem. 282:27610-27621. - PubMed

Publication types

MeSH terms

LinkOut - more resources