. 2010 Jan 22;285(4):2834-46.
doi: 10.1074/jbc.M109.030577. Epub 2009 Nov 20.

Nuclear isoforms of fibroblast growth factor 2 are novel inducers of hypophosphatemia via modulation of FGF23 and KLOTHO

Affiliations

Nuclear isoforms of fibroblast growth factor 2 are novel inducers of hypophosphatemia via modulation of FGF23 and KLOTHO

Liping Xiao et al. J Biol Chem. .

Abstract

FGF2 transgenic mice were developed in which type I collagen regulatory sequences drive the nuclear high molecular weight FGF2 isoforms in osteoblasts (TgHMW). The phenotype of TgHMW mice included dwarfism, decreased bone mineral density (BMD), osteomalacia, and decreased serum phosphate (P(i)). When TgHMW mice were fed a high P(i) diet, BMD was increased, and dwarfism was partially reversed. The TgHMW phenotype was similar to mice overexpressing FGF23. Serum FGF23 was increased in TgHMW mice. Fgf23 mRNA in bones and fibroblast growth factor receptors 1c and 3c and Klotho mRNAs in kidneys were increased in TgHMW mice, whereas the renal Na(+)/P(i) co-transporter Npt2a mRNA was decreased. Immunohistochemistry and Western blot analyses of TgHMW kidneys showed increased KLOTHO and decreased NPT2a protein. The results suggest that overexpression of HMW FGF2 increases FGF23/FGFR/KLOTHO signaling to down-regulate NPT2a, causing P(i) wasting, osteomalacia, and decreased BMD. We assessed whether HMW FGF2 expression was altered in the Hyp mouse, a mouse homolog of the human disease X-linked hypophosphatemic rickets/osteomalacia. Fgf2 mRNA was increased in bones, and Western blots showed increased FGF2 protein in nuclear fractions from osteoblasts of Hyp mice. In addition, immunohistochemistry demonstrated co-localization of FGF23 and HMW FGF2 protein in osteoblasts and osteocytes from Hyp mice. This study reveals a novel mechanism of regulation of the FGF23-P(i) homeostatic axis.


Figures
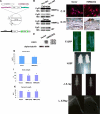
FIGURE 1.
FIGURE 1.
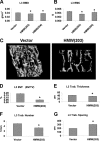
Generation and identification of mice overexpressing hFGF2 HMW isoforms. A, schematic of Col3.6-HMW Fgf2 isoforms-IRES-GFPsaph expression vector. B, Northern blots show the overexpression of Fgf2 mRNA in calvariae and femurs from two lines (line 203 and line 204) of TgHMW compared with their non-Tg WT littermates. Immunofluorescent (IF) staining of cultured calvarial osteoblasts (C) and anti-FGF2 immunostaining (IH) of femurs (D) shows intense FGF2 labeling in nuclei of osteoblast from TgHMW mice compared with TgVector. E, analysis of FGF2 protein isoforms in BMSCs from TgVector and HMW mice. Starting on day 3 of culture, BMSC were fed with osteogenic differentiation media, and cells were cultured for 2 weeks. Western analysis of nuclear proteins revealed increased 22-, 23-, and 24-kDa FGF2 protein in cultures from TgHMW mice. F, scanning fluorescent microscopy shows the GFP expression in femurs of 7-day-old TgVector and TgHMW mice. G, serum FGF2 levels of 2-month-old TgVector and TgHMW mice (n = 8). H, gross appearance (bright field (BF)) of 2-month-old TgVector and TgHMW mice. I, body weight of 2-month-old TgVector and TgHMW mice (n = 13–36). J, x-ray image of 2-month-old TgVector and TgHMW mice. K, femoral length of 2-month-old TgVector and TgHMW mice (n = 6–16). L, x-ray image of lower limbs from 2-month-old TgVector and TgHMW mice. Values are mean ± S.E. *, significantly different from TgVector group, p < 0.05.
FIGURE 2.
FIGURE 2.
Dual beam x-ray absorptiometry and micro-CT analysis of L3 vertebrae from TgVector and TgHMW mice. A, L3 BMD (n = 13–36); B, L3 BMC (n = 13–36); C, three-dimensional trabecular structure of L3 of 2-month-old male homozygous TgVector and TgHMW mice (n = 5–11). D–G, three-dimensional microstructural parameters were calculated using two-dimensional data obtained from micro-CT of vertebral bone. Calculated morphometric indices included bone volume density (BV/TV) (D), trabecular thickness (Trab. thickness) (DT-Tb-Th) (E), trabecular number (Trab. number) (F), and trabecular spacing (Trab. spacing) (G). *, significantly different from TgVector group (p < 0.05).
FIGURE 3.
FIGURE 3.
Bone histomorphometry analysis of L3 vertebrae and bone marker gene expression in tibiae from 2-month-old TgVector and TgHMW mice. A–D, static bone histomorphometry analysis of L3 vertebrae from TgVector and TgHMW mice (n = 6). A, BV/TV. B, osteoblast surface (ObS)/BS. C, osteoclast surface (OcS). D, osteoclast number (OcNo)/BS. E–H, dynamic bone histomorphometry analysis of L3 vertebrae from TgVector and TgHMW mice (n = 7). E, mineralizing surface (MS)/BS. F, bone formation rate (BFR)/BS. G, interlabel thickness (IrLTh). H, mineral apposition rate (MAR). Values are mean ± S.E. *, significantly different from TgVector group, p < 0.05. I, von Kossa staining of non-decalcified sections from L3 vertebrae showed decreased mineralized trabuculae in TgHMW mice. J, calcein double labeling showed decreased interlabel thickness in TgHMW mice compared with TgVector mice. K–N, real-time RT-PCR analysis of Col1a1, osteopontin (OP), osteocalcin (OC), and matrix γ-carboxyglutamic acid protein (MGP) mRNA expression in tibiae from both genotypes. Data are expressed as mean ± S.E. from three independent experiments. *, significantly different from TgVector, p < 0.05.
FIGURE 4.
FIGURE 4.
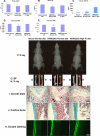
High phosphate diet partially rescues the bone phenotype of TgHMW mice. TgVector and TgHMW mice were fed either a normal or high phosphate diet for 1 month immediately after weaning. They were sacrificed at 51 days old, and the following parameters were determined. A, body weight of TgVector and TgHMW mice (n = 4–7). B, serum phosphate level of TgVector and TgHMW mice (n = 4–7). C, serum FGF23 level of TgVector and TgHMW mice (n = 5–7). D, total body BMD of TgVector and TgHMW mice (n = 4–7). E, total body BMC of TgVector and TgHMW mice (n = 4–7). F, x-ray of whole body of TgVector and TgHMW mice. G, bright field (BF) of femurs from TgVector and TgHMW mice. H, x-ray of femurs from TgVector and TgHMW mice. Shown is Masson trichrome stain of growth plate (I) (note the arrows pointing to islands of cartilage surrounded by chondrocytes and mineralized bone) and cortical bone (magnification, ×100) of femurs from TgVector and TgHMW mice (J). K, calcein double labeling (magnification, ×200) of femurs from TgVector and TgHMW male mice. *, p < 0.05.
FIGURE 5.
FIGURE 5.
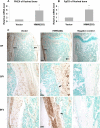
Effect of hFGF2 HMW isoform overexpression on Phex mRNA and Fgf23 mRNA and protein in bone. Real-time RT-PCR analysis of PHEX (A) and Fgf23 (B) expression in flushed bone. Data are expressed as mean ± S.E. from three experiments. *, significantly different from TgVector, p < 0.05. C, detection of FGF23 protein expression in femurs from TgVector and TgHMW by immunohistochemistry staining. Increased FGF23 staining in osteocytes (arrows) and osteoblasts in femurs of TgHMW mice compared with TgVector mice. BF, bright field.
FIGURE 6.
FIGURE 6.
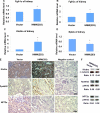
Effect of hFGF2 HMW isoform overexpression on FGF23-KLOTHO axis in kidney. Shown is real-time RT-PCR analysis of Fgfr1c (A), Fgfr3c (B), Klotho (C), and Npt2a (D) mRNA expression in kidney from 2-month-old male mice. Data are expressed as mean ± S.E. from three experiments. *, significantly different from TgVector, p < 0.05. E, immunohistochemistry for detection of KLOTHO, Pp44/42, and NPT2a protein expression in mouse kidneys from 2-month-old male TgVector and TgHMW mice. Note increased KLOTHO protein expression in both proximal and distal tubules of kidney from TgHMW mice. Negative control had no primary antibody during immunostaining. F, Western blot analysis of KLOTHO, Pp44/42, and NPT2a protein. Protein extracted from kidneys showed increased expression of KLOTHO and Pp44/42 but decreased expression of NPT2a from TgHMW mice compared with TgVector mice.
FIGURE 7.
FIGURE 7.
Effect of hFGF2 HMW isoform overexpression on Fgf23 and Phex transcripts in cultured Fgf2 KO calvarial osteoblasts. A, schematic of CMV-HMW Fgf2 isoforms-IRES-eGFP expression vector. Shown is real-time RT-PCR analysis of Fgf2 (B), Phex (C), and Fgf23 (D) mRNA expression in Fgf2 KO calvarial osteoblasts. Data are expressed as mean ± S.E. from three experiments. *, significantly different from vector transduction, p < 0.05.
FIGURE 8.
FIGURE 8.
Analysis of Phex, Fgf23, and Fgf2 mRNA and FGF2 protein in bones from Hyp mice. Shown is real-time RT-PCR analysis of Phex (A), Fgf23 (B), and Fgf2 (C) mRNA expression in flushed bones. D, Western blot detection of FGF2 and FGF23 protein expression in nuclear fractions of BMSCs from WT and Hyp cultured for 2 and 3 weeks in osteogenic media. Increased HMW FGF2 and FGF23 protein is observed in nuclear fractions from Hyp mice compared with WT mice.
FIGURE 9.
FIGURE 9.
Immunohistochemistry for detection of FGF23 and FGF2 protein in osteoblasts from Hyp mice. BMSCs from WT and Hyp mice were grown to confluence for 7 days and then cultured in osteogenic medium for an additional 7 days. Immunohistochemistry for detection of FGF23 (green), FGF2 (red), and 4′,6-diamidino-2-phenylindole (DAPI; blue) labeling of nuclei was performed. Note increased FGF23 and FGF2 protein expression in Hyp cultures. Merge images show co-localization of FGF23 and FGF2 in many cells from Hyp mice.
FIGURE 10.
FIGURE 10.
Immunohistochemistry for detection of FGF23 and FGF2 in cortical bone from WT and Hyp mice. Tibias were collected from WT and Hyp mice, and immunohistochemistry was performed on frozen sections for detection of FGF23 (green) and FGF2 (red). The periosteal (P) and endosteal (E) regions of the cortical bones are shown. Nuclei were labeled with 4′,6-diamidino-2-phenylindole (DAPI; blue). Increased FGF23 and FGF2 staining was observed in osteocytes (note the arrowheads) in tibiae of Hyp mice compared with WT mice. Merge images show co-localization (yellow) of FGF23 and FGF2 in osteocytes from Hyp mice.

Similar articles

Cited by

References

    1. Hurley M. M., Marie P. J., Florkiewicz R. Z. (2002) in Principles of Bone Biology (Bilezikian J. P., Raisz L. G., Rodan G. A. eds) pp. 825–851, Academic Press, Inc., San Diego, CA
    1. Muenke M., Schell U. (1995) Trends. Genet. 11, 308–313 - PubMed
    1. De Moerlooze L., Dickson C. (1997) Curr. Opin. Genet. Dev. 7, 378–385 - PubMed
    1. Coffin J. D., Florkiewicz R. Z., Neumann J., Mort-Hopkins T., Dorn G. W., 2nd, Lightfoot P., German R., Howles P. N., Kier A., O'Toole B. A., Sasse J., Gonzalez A. M., Baird A., Doetschman T. (1995) Mol. Biol. Cell. 6, 1861–1873 - PMC - PubMed
    1. Yu X., White K. E. (2005) Cytokine Growth Factor Rev. 16, 221–232 - PubMed

Publication types

MeSH terms