

Brain-selective overexpression of human Angiotensin-converting enzyme type 2 attenuates neurogenic hypertension
- PMID: 19926873
- PMCID: PMC2818798
- DOI: 10.1161/CIRCRESAHA.109.208645
Brain-selective overexpression of human Angiotensin-converting enzyme type 2 attenuates neurogenic hypertension
Abstract
Rationale: Angiotensin converting enzyme type 2 (ACE2) is a new member of the brain renin-angiotensin system, that might be activated by an overactive renin-angiotensin system.
Objective: To clarify the role of central ACE2 using a new transgenic mouse model with human (h)ACE2 under the control of a synapsin promoter, allowing neuron-targeted expression in the central nervous system.
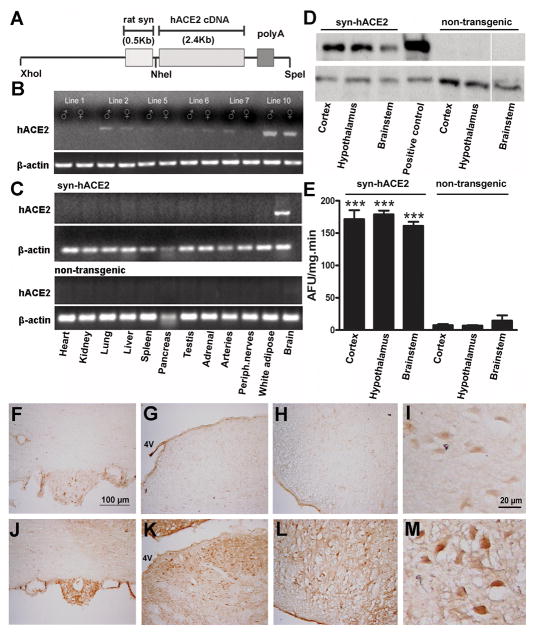
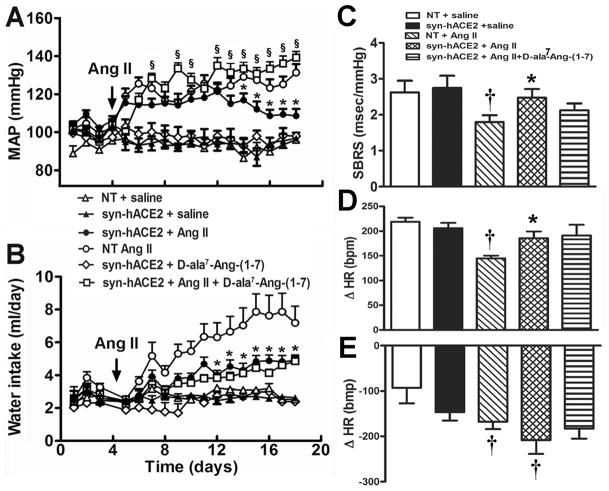
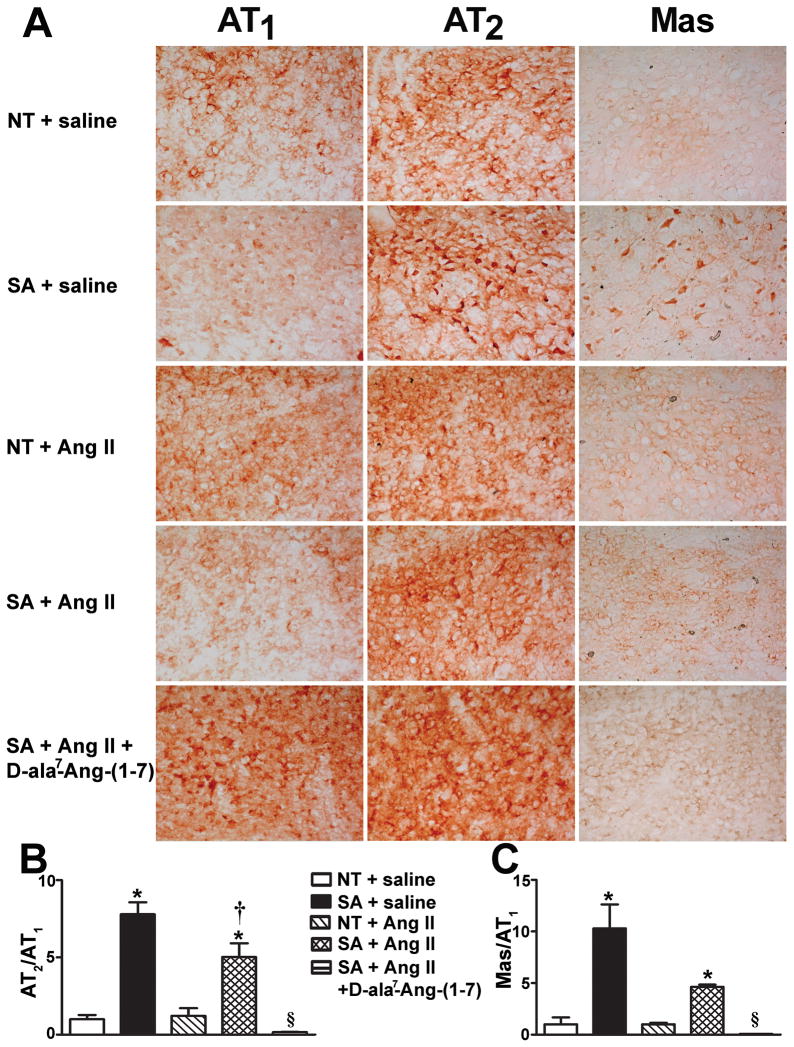
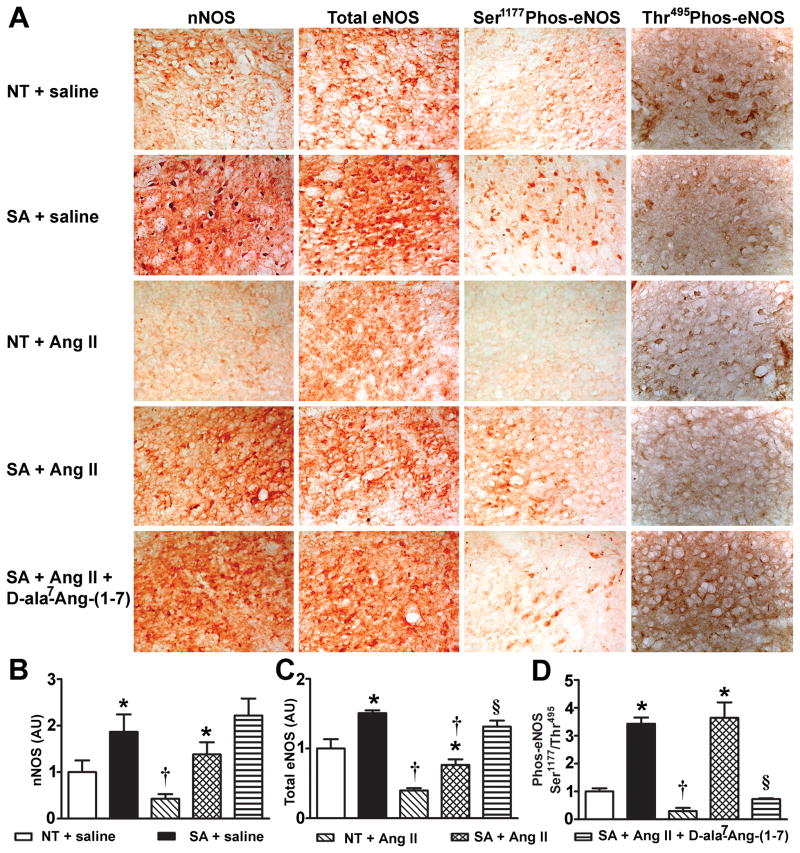
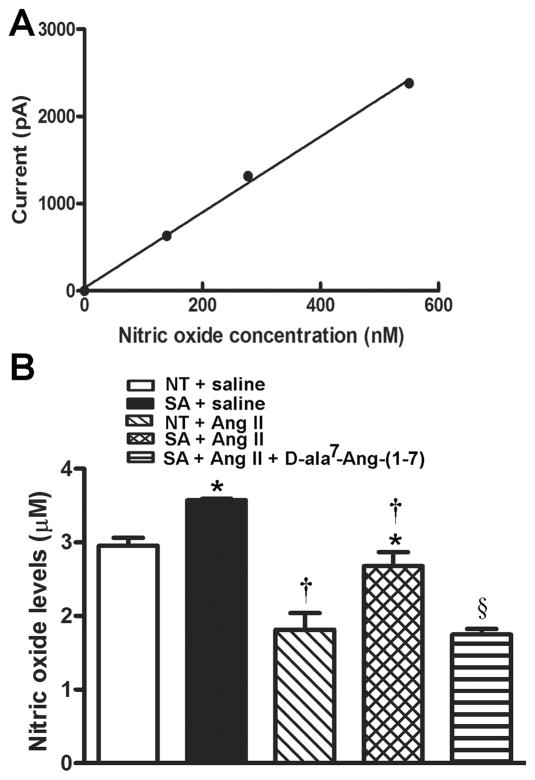
Methods and results: Syn-hACE2 (SA) transgenic mice exhibit high hACE2 protein expression and activity throughout the brain. Baseline hemodynamic parameters (telemetry), autonomic function, and spontaneous baroreflex sensitivity (SBRS) were not significantly different between SA mice and nontransgenic littermates. Brain-targeted ACE2 overexpression attenuated the development of neurogenic hypertension (Ang II infusion: 600 ng/kg per minute for 14 days) and the associated reduction of both SBRS and parasympathetic tone. This prevention of hypertension by ACE2 overexpression was reversed by blockade of the Ang-(1-7) receptor (d-Ala7-Ang-[1-7]; 600 ng/kg per minute). Brain angiotensin II type 2 (AT(2))/AT(1) and Mas/AT(1) receptor ratios were significantly increased in SA mice. They remained higher following Ang II infusion but were dramatically reduced after Ang-(1-7) receptor blockade. ACE2 overexpression resulted in increased NOS and NO levels in the brain, and prevented the Ang II-mediated decrease in NOS expression in regions modulating blood pressure regulation.
Conclusions: ACE2 overexpression attenuates the development of neurogenic hypertension partially by preventing the decrease in both SBRS and parasympathetic tone. These protective effects might be mediated by enhanced NO release in the brain resulting from Mas and AT(2) receptor upregulation. Taken together, our data highlight the compensatory role of central ACE2 and its potential benefits as a therapeutic target for neurogenic hypertension.
Figures
Similar articles
-
Brain angiotensin-converting enzyme type 2 shedding contributes to the development of neurogenic hypertension.Circ Res. 2013 Oct 12;113(9):1087-1096. doi: 10.1161/CIRCRESAHA.113.301811. Epub 2013 Sep 6. Circ Res. 2013. PMID: 24014829 Free PMC article.
-
Angiotensin II type 1 receptor-mediated reduction of angiotensin-converting enzyme 2 activity in the brain impairs baroreflex function in hypertensive mice.Hypertension. 2009 Feb;53(2):210-6. doi: 10.1161/HYPERTENSIONAHA.108.123844. Epub 2009 Jan 5. Hypertension. 2009. PMID: 19124678 Free PMC article.
-
Brain-selective overexpression of angiotensin-converting enzyme 2 attenuates sympathetic nerve activity and enhances baroreflex function in chronic heart failure.Hypertension. 2011 Dec;58(6):1057-65. doi: 10.1161/HYPERTENSIONAHA.111.176636. Epub 2011 Oct 24. Hypertension. 2011. PMID: 22025374 Free PMC article.
-
ACE2 and vasoactive peptides: novel players in cardiovascular/renal remodeling and hypertension.Ther Adv Cardiovasc Dis. 2015 Aug;9(4):217-37. doi: 10.1177/1753944715597623. Epub 2015 Aug 13. Ther Adv Cardiovasc Dis. 2015. PMID: 26275770 Review.
-
ACE2 and the Homolog Collectrin in the Modulation of Nitric Oxide and Oxidative Stress in Blood Pressure Homeostasis and Vascular Injury.Antioxid Redox Signal. 2017 Apr 20;26(12):645-659. doi: 10.1089/ars.2016.6950. Epub 2017 Jan 12. Antioxid Redox Signal. 2017. PMID: 27889958 Review.
Cited by
-
Manifestation of renin angiotensin system modulation in traumatic brain injury.Metab Brain Dis. 2021 Aug;36(6):1079-1086. doi: 10.1007/s11011-021-00728-1. Epub 2021 Apr 9. Metab Brain Dis. 2021. PMID: 33835385 Free PMC article. Review.
-
Angiotensin-converting enzyme 2: the first decade.Int J Hypertens. 2012;2012:307315. doi: 10.1155/2012/307315. Epub 2011 Nov 10. Int J Hypertens. 2012. PMID: 22121476 Free PMC article.
-
Sensitization of slow pressor angiotensin II (Ang II)-initiated hypertension: induction of sensitization by prior Ang II treatment.Hypertension. 2012 Feb;59(2):459-66. doi: 10.1161/HYPERTENSIONAHA.111.185116. Epub 2012 Jan 3. Hypertension. 2012. PMID: 22215719 Free PMC article.
-
ACE2 and ADAM17 Interaction Regulates the Activity of Presympathetic Neurons.Hypertension. 2019 Nov;74(5):1181-1191. doi: 10.1161/HYPERTENSIONAHA.119.13133. Epub 2019 Sep 30. Hypertension. 2019. PMID: 31564162 Free PMC article.
-
Neuronal over-expression of ACE2 protects brain from ischemia-induced damage.Neuropharmacology. 2014 Apr;79:550-8. doi: 10.1016/j.neuropharm.2014.01.004. Epub 2014 Jan 15. Neuropharmacology. 2014. PMID: 24440367 Free PMC article.
References
-
- Paul M, Poyan Mehr A, Kreutz R. Physiology of Local Renin-Angiotensin Systems. Physiol Rev. 2006;86:747–803. - PubMed
-
- Bader M, Ganten D. Update on tissue renin–angiotensin systems. J Mol Med. 2008;86:615–621. - PubMed
-
- Lazartigues E, Feng Y, Lavoie JL. The two fACEs of the tissue renin-angiotensin systems: implication in cardiovascular diseases. Curr Pharm Des. 2007;13:1231–1245. - PubMed
-
- Feng Y, Yue X, Xia H, Bindom SM, Hickman PJ, Filipeanu CM, Wu G, Lazartigues E. Angiotensin-Converting Enzyme 2 Overexpression in the Subfornical Organ Prevents the Angiotensin II-Mediated Pressor and Drinking Responses and Is Associated With Angiotensin II Type 1 Receptor Downregulation. Circ Res. 2008;102:729–736. - PMC - PubMed
Publication types
MeSH terms
Substances
Grants and funding
- R21 NS052479/NS/NINDS NIH HHS/United States
- P20 RR018766-057611/RR/NCRR NIH HHS/United States
- R01 HL093178-02/HL/NHLBI NIH HHS/United States
- NS052479/NS/NINDS NIH HHS/United States
- R01 HL093178-03/HL/NHLBI NIH HHS/United States
- P20 RR018766/RR/NCRR NIH HHS/United States
- R21 NS052479-03/NS/NINDS NIH HHS/United States
- R21 NS052479-02S1/NS/NINDS NIH HHS/United States
- R01 HL093178/HL/NHLBI NIH HHS/United States
- RR018766/RR/NCRR NIH HHS/United States
- R01 HL093178-01S1/HL/NHLBI NIH HHS/United States
- R01 HL093178-01/HL/NHLBI NIH HHS/United States
- HL093178/HL/NHLBI NIH HHS/United States
- T32 GM007337/GM/NIGMS NIH HHS/United States
LinkOut - more resources
Full Text Sources
Other Literature Sources
Medical
Molecular Biology Databases
Research Materials
Miscellaneous
