Comparative Study
. 2009 Nov 18;29(46):14553-70.
doi: 10.1523/JNEUROSCI.3287-09.2009.

Correlations of neuronal and microvascular densities in murine cortex revealed by direct counting and colocalization of nuclei and vessels

Affiliations
Comparative Study

Correlations of neuronal and microvascular densities in murine cortex revealed by direct counting and colocalization of nuclei and vessels

Philbert S Tsai et al. J Neurosci. .

Abstract

It is well known that the density of neurons varies within the adult brain. In neocortex, this includes variations in neuronal density between different lamina as well as between different regions. Yet the concomitant variation of the microvessels is largely uncharted. Here, we present automated histological, imaging, and analysis tools to simultaneously map the locations of all neuronal and non-neuronal nuclei and the centerlines and diameters of all blood vessels within thick slabs of neocortex from mice. Based on total inventory measurements of different cortical regions ( approximately 10(7) cells vectorized across brains), these methods revealed: (1) In three dimensions, the mean distance of the center of neuronal somata to the closest microvessel was 15 mum. (2) Volume samples within lamina of a given region show that the density of microvessels does not match the strong laminar variation in neuronal density. This holds for both agranular and granular cortex. (3) Volume samples in successive radii from the midline to the ventral-lateral edge, where each volume summed the number of cells and microvessels from the pia to the white matter, show a significant correlation between neuronal and microvessel densities. These data show that while neuronal and vascular densities do not track each other on the 100 mum scale of cortical lamina, they do track each other on the 1-10 mm scale of the cortical mantle. The absence of a disproportionate density of blood vessels in granular lamina is argued to be consistent with the initial locus of functional brain imaging signals.


Figures
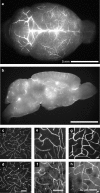
Figure 1.
Figure 1.
Perfusion of brain vasculature with a fluorescent gel-based perfusate in comparison with a label of endothelial cells. We visualize the brain vasculature in a NIH Swiss mouse. a, Wide-field epi-fluorescence photograph montage of a NIH Swiss mouse brain perfused with a fluorescein-conjugated gel. Both veins and arteries are visibly labeled, although some surface vessels, particularly those that were immediately contiguous to the central sinus, were lost during the brain extraction process. b, Wide-field epi-fluorescence photograph of a sagittal section from a brain perfused with fluorescein-conjugated gel. c–h, Evidence of completeness of the gel fill. Maximal projections from TPLSM image stacks >50 μm of depth taken from the brains of transgenic mice with CFP-expressing endothelial cells after perfusion with fluorescein-conjugated gel. The top row shows the fluorescein label in neocortex (c), cerebellum (e), and striatum (g). The bottom row shows the CFP transgenic label in the same fields-of-view (d, f, h). All vessels expressing CFP also contain fluorescein-conjugated gel perfusate, and vice versa. Note that in the cerebellum (f), CFP is also expressed within the Purkinje cells (Tsai et al., 2003).
Figure 2.
Figure 2.
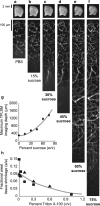
Tissue clearing for TPLSM with sucrose and Triton X-100 immersion to increase imaging depth with minimal tissue shrinkage. All data are from Sprague Dawley rats. a–f, Maximal projections in x–z generated from TPLSM image stacks taken in cortex of the same 2 mm thick coronal tissue section after immersion in increasing concentrations of sucrose in PBS. Low-magnification photographs of the tissue section after each immersion step are shown above the TPLSM projection. g, Summary of the maximum TPLSM imaging depth versus concentration of sucrose for the tissue shown in panels a to f; the curve is solely to guide the eye. h, Summary plot of the reduction in tissue shrinkage in a 1-mm-thick coronal section versus concentration of Triton X-100. Squares and triangles represent two different datasets. The curve is solely to guide the eye.
Figure 3.
Figure 3.
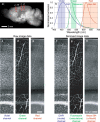
Three-channel TPLSM vascular and cell nuclei imaging from three regions of mouse cortex at a depth of 300 μm. Sagittal sections from a NIH Swiss mouse, 1.4 mm thick, were imaged at three rostral-caudal positions. a, An epi-fluorescence micrograph of the sagittal section. The three rectangles indicate three regions of interest centered at bregma +1 mm, bregma −1 mm, and bregma −2 mm, that span the depth of cortex. b, Emission spectra for the nuclear stain DAPI, the vascular stain fluorescein, and the neuronal nuclear label Alexa 594, along with the collection bands for emitted light in the violet, green, and red. c–e, Maximal projection of TPLSM image data from the bregma −2 mm region before spectral demixing. While the violet spectral window (c) contains predominantly DAPI signal, the green spectral window (d) contains both fluorescein and DAPI signal components. Similarly, the red spectral window (e) contains contributions from Alexa 594, fluorescein, and DAPI. f–h, The same data as shown in ce after spectral demixing.
Figure 4.
Figure 4.
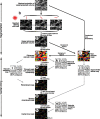
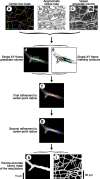
Process flow diagram for the analysis of cellular and vascular volumetric data. Three-channel data are normalized, spectrally demixed, montaged, and then divided up into small local three-dimensional sub-blocks. Each sub-block is processed independently. Vascular processing begins by matched filtering to 82 rods at various orientations to produce a “Rod-enhanced sub-block” (detailed in Fig. 6). Local filtering and variable local thresholding is applied to produce a “Raw vascular mask” that maintains appropriate vessel diameters, and a connectivity-preserved “Enhanced vascular mask.” Connectivity-conserved thinning produces a monofilament “Centerline mask.” Voxel-by-voxel evaluation of each center-line point in the yields a true vessel radius based on the local intensity pattern in the “Vascular grayscale sub-blocks.” Isotropic, volume-accurate masks are reconstructed from the centerline and radius data by successive placement of overlapping spheres. Voxel-by-voxel radius selection is used to categorize vessel regions by size. Finally, the various sub-blocks are restitched to produce a montaged mask of the full dataset. Cell nuclei data processing begins with matched filtering to a spherically symmetric kernel to produce a “Cell nuclei enhanced grayscale sub-block.” The “Cell nuclei enhanced grayscale sub-blocks” are automatically thresholded (detailed in Fig. 5) to produce “Cell nuclei masks” from which cell centroids are computed and concatenated. Finally, using the centroids and cell masks from the cell nuclei data, local evaluation of the signal in the corresponding pixels of the neuron nuclei grayscale sub-blocks leads to classification of each cell nuclei as neuronal or non-neuronal (detailed in Fig. 8).
Figure 5.
Figure 5.
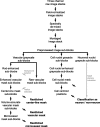
Process flow diagram for automated identification and segmentation of all cell nuclei. a, b, Cell nuclei data processing begins with matched filtering of the “Cell nuclei grayscale volume” (a) with a spherically symmetric kernel to produce a “Cell nuclei enhanced grayscale volume” (b). c, The locus of local intensity maxima in the “Cell nuclei enhanced grayscale volume” (b) are determined, their corresponding intensities are compiled, and a threshold is set at a z-score of 5 for the distribution of peak intensity values. This threshold is applied to the “Cell nuclei enhanced grayscale volume” (b); connected volumes with <100 voxels are eliminated. The result is a “Cell nuclei mask.” d, Application of an ultimate erosion process to the “Cell nuclei mask” (c) results in a “Cell centroid mask,” from which a list of cell centroid locations is compiled. e, A minimal cell diameter is used to merge multiple centroid points within the same cell and form the “Non-overlapping cell centroid mask.”
Figure 6.
Figure 6.
Process flow diagram for automated identification and segmentation of vascular subvolumes. a, b, Processing begins by matched filtering of the “Vessel grayscale volume sub-block” (a) to 82 rods at various orientations in three-dimensions, yielding 82 rod filtered volumes (b). c, The voxel-by-voxel maximal response across all rod filtered volumes (b) is retained to produce a “Vessel enhanced grayscale volume.” d, Local filtering and a local variable threshold is applied to the “Vessel enhanced grayscale volume” (c) to produce an “Enhanced vascular mask.” This mask overestimates vascular diameters, but reduces the occurrence of small gaps in the vasculature. e, A connectivity-conserving thinning process is applied to the “Enhanced vascular mask” (c) based on the auxiliary “Removal sequence map” (k; defined below). This produces a “Thinned mask with preserved connectivity” that may contain webbed structures of small loops and hairs. f, A recentering process is applied to the “Thinned mask” (e) based on the auxiliary “Vascular centering map 1” (l; defined below) to collapse the webbed structures and results in a “Recentered mask.” g, Short hairs are removed from the “Recentered mask” (f) based on the auxiliary “Approximate radius map” (k; defined below) to produce a “Shaved recentered mask.” h, The recentering process is repeated on the “Shaved recentered mask” (g) based on the auxiliary “Vascular centering map 2” (m; defined below) to collapse small loops in the mask, and results in a monofilament “Center-line mask” of the vasculature. We now turn to auxiliary calculations. i, An auxiliary mask is generated by local filtering and a local variable thresholding of the “Vessel grayscale volume” to produce the “Raw vascular mask.” This mask contains approximately accurate diameters, but may contain small gaps along vessels of low signal-to-noise. j–m, Three auxiliary maps are generated by filtering the Euclidean distance transforms of specific masks. The “Approximate radius mask” (j) is derived from the “Raw vascular map” (i). The “Removal sequence map” (k) and the “Vascular centering map 1” (l) are derived from the “Enhanced vascular mask” (d). Last, “Vascular centering map 2” (m) is generated from the “Shaved recentered mask” (g) by both dilation and Euclidean distance transformation.
Figure 7.
Figure 7.
Process flow diagram for determination of vascular radii. a–c, Radii determination for each sub-block is performed using the appropriate “Center-line mask” (a) along with the corresponding “Approximate radius map” (b) and “Vessel grayscale volume” (c) generated in the vascular segmentation process (Fig. 6). The white box denotes the region expanded for panels (d) to (h). d, e, Gray-scale image (d) and contour lines (e) of the intensity in a single xy frame of the “Vessel grayscale volume” around center-line point (red square). The green box defines a local neighborhood around the center-line point. f, The first refinement to the estimate of the radius (red contour) calculated from the maximum of an Euclidean distance transform, as found from a threshold at a fixed percentage of the maximum intensity in the local neighborhood. g, The second refinement to the estimate of the radius based on cylindrical vessels and an estimated point-spread function for the microscope. h, i, A volume-accurate vasculature binary mask is formed from overlapping spheres of the appropriate radii at each centerline point.
Figure 8.
Figure 8.
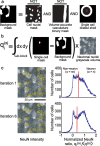
Process flow for discrimination of neuronal versus non-neuronal cell nuclei. a, A background mask is generated for each cell nucleus. A dilated shell of the target cell's nucleus mask is intersected with the inverse of the full “Cell nucleus mask” (Fig. 5c) and the inverse of the “Volume-accurate vasculature binary mask” (Fig. 7h). b, The mean of the “Neuronal nucleus grayscale volume” within the background region is subtracted from the mean signal within the target cell's nucleus mask to define a NeuN ratio, qi(α), where “i” labels the nucleus and “α” signifies neuronal or non-neuronal. c, An iterative process is applied to classify each nucleus as neuronal or non-neuronal based on the ratio of the value of qi(α) relative to the mean value of its local neuronal neighbors. The classification of each nucleus is subject to change at each iteration, and only those nuclei currently classified as neurons contribute to the mean value.
Figure 9.
Figure 9.
Volumetric reconstruction of vasculature and cell nuclei. A 900 × 650 × 250 μm3 volume of cortical tissue from a sagittal section. The volume is centered at 2 mm caudal of bregma and 1.1 mm lateral of the midline. a, The montaged centerline mask (red) overlaid with 3 μm spheres at the centroid location for each neuronal (green) and non-neuronal (blue) nucleus. The side figure illustrates the orientation of the volume. b, Expanded view of sub-region of a. Black lines indicate the nearest vascular component to each cellular nuclei. For clarity, only vascular components within the visualized sub-region were considered; cellular nuclei near the sub-region border may be closer to a vascular component that is out of the current view. c, Histogram of the distances between all neuronal nuclei in a slab to the nearest microvascular component (green). The null hypothesis is the distribution of all distances beyond a minimum possible distance to the nearest vessel (red). The two curves are statistically different.
Figure 10.
Figure 10.
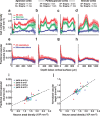
Vascular and cellular density plots from thick sagittal sections. Vascular and cellular densities are computed for the processed data from thick sagittal sections with center coordinates as noted. ad, The number densities of all cells (red), neurons (green), and non-neurons (blue) per mm3 of tissue as a function of cortical depth. eh, The fractional volume occupied by all vasculature (red) and by microvasculature (diameter <6 μm; blue) are plotted as a function of depth into cortex from the dorsal cortical surface. i, Microvessel fractional volume versus neuron areal density from different animals. The different circles indicate data from locations in ad as noted. The microvascular density and neuron areal density are significantly correlated. j, Normalized vascular length per volume versus neuron areal density. The normalized vessel length and neuron areal density are significantly correlated.
Figure 11.
Figure 11.
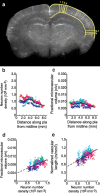
Vascular and cellular density plots from thick coronal sections. Vascular and cellular densities are computed for the processed data from thick coronal sections. a, A microphotograph of a 1 mm thick coronal section between 0 and −1 mm relative to bregma in which the vasculature has been labeled by fluorescent gel perfusion. After staining and clearing, the entire cortex is imaged and processed as individual wedges, w1 through wN, that run perpendicular to the pial surface and span the depth of cortex. The spacing and width of the wedges is 50 μm along the pial surface. b, Neuronal number density versus distance from the midline along the pial surface. c, Fractional microvascular volume plotted versus distance from the midline. Each dot in b and c represents the mean density across a single wedge. Different colored dots represent different coronal sections (n = 5 sections across 2 animals). The black lines are a 50-point running average across all coronal sections. d, Fractional microvascular volume plotted versus neuronal number density. e, Normalized vascular length plotted versus neuronal number density. The black lines in d and e represent a linear regression across all points.
Figure 12.
Figure 12.
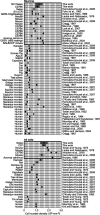
Compendium of literature results on neuronal and all cell densities. Data for mouse are derived from the present and published work (Leuba and Rabinowicz, 1979; Brunjes, 1985; Schüz and Palm, 1989; Fukui et al. 1992, Ma et al., 1999; Abreu-Villaça et al., 2002; Bonthius et al., 2004; Hodge et al., 2005; Irintchev et al., 2005; Herculano-Houzel et al., 2006; Lefort et al., 2009; Lyck et al., 2007). Data for other species are derived from the original published work (Cragg, 1967; Tower and Young, 1973; O'Kusky and Colonnier, 1982; Mountjoy et al., 1983; Barey and Leuba, 1986; Garey and Leuba, 1986; Harper and Kril, 1989; Kril and Harper, 1989; Regeur et al., 1994; Witelson et al., 1995; Pakkenberg and Gundersen, 1997; Gredal et al., 2000; Gittins and Harrison, 2004; Herculano-Houzel et al., 2006, 2007) or, for the cases of Chow et al. (1950), Tower and Elliot (1952), Sholl (1959), Ramon-Moliner (1961), and Cowey (1964) obtained from the compilation in the study by Cragg (1967). For all datasets, the black dots represent mean values. For data from this work, dark gray bars encompass the SD. For previously published data, light gray bars encompass the SD and the absence of bars implies that the SD is unknown.
Figure 13.
Figure 13.
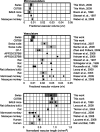
Compendium of literature results on microvascular and all vascular densities. Data for mouse are derived from the present and published work (Boero et al., 1999; Heinzer et al., 2006, ; Serduc et al., 2007; Vérant et al., 2007; Zhao and Pollack, 2009). Data for other species are derived from published work (Bell and Ball, 1985; Stewart et al., 1997; Rousselle et al., 1998; Schlageter et al., 1999; Tieman et al., 2004; Lauwers et al., 2008; Weber et al., 2008; Lecoq et al., 2009; Risser et al., 2009). For all datasets, the black dots represent mean values. For data from this work, dark gray bars encompass the SD. For previously published data, light gray bars encompass the SD and the absence of bars implies that the SD is unknown.

Similar articles

Cited by

References

    1. Abreu-Villaça Y, Silva WC, Manhães AC, Schmidt SL. The effect of corpus callosum agenesis on neocortical thickness and neuronal density of BALB/cCF mice. Brain Res Bull. 2002;58:411–416. - PubMed
    1. Bass NH, Hess HH, Pope A, Thalheimer C. Quantitative cytoarchitectonic distribution of neurons, glia, and DNa in rat cerebral cortex. J Comp Neurol. 1971;143:481–490. - PubMed
    1. Bell MA, Ball MJ. Laminar variation in the microvascular architecture of normal human visual cortex (area 17) Brain Res. 1985;335:139–143. - PubMed
    1. Bjornsson CS, Lin G, Al-Kofahi Y, Narayanaswamy A, Smith KL, Shain W, Roysam B. Associative image analysis: A method for automated quantification of 3D multi-parameter images of brain tissue. J Neurosci Methods. 2008;170:165–178. - PMC - PubMed
    1. Boas DA, Jones SR, Devor A, Huppert TJ, Dale AM. A vascular anatomical network model of the spatio-temporal response to brain activation. Neuroimage. 2008;40:1116–1129. - PMC - PubMed

Publication types

LinkOut - more resources