. 2010 Jan 14;102(4):231-44.
doi: 10.1042/BC20090074.

The GIT-PIX complexes regulate the chemotactic response of rat basophilic leukaemia cells

Affiliations

The GIT-PIX complexes regulate the chemotactic response of rat basophilic leukaemia cells

Manuela Gavina et al. Biol Cell. .

Abstract

Background information: Cell motility entails the reorganization of the cytoskeleton and membrane trafficking for effective protrusion. The GIT-PIX protein complexes are involved in the regulation of cell motility and adhesion and in the endocytic traffic of members of the family of G-protein-coupled receptors. We have investigated the function of the endogenous GIT complexes in the regulation of cell motility stimulated by fMLP (formyl-Met-Leu-Phe) peptide, in a rat basophilic leukaemia RBL-2H3 cell line stably expressing an HA (haemagglutinin)-tagged receptor for the fMLP peptide.

Results: Our analysis shows that RBL cells stably transfected with the chemoattractant receptor expressed both GIT1-PIX and GIT2-PIX endogenous complexes. We have used silencing of the different members of the complex by small interfering RNAs to study the effects on a number of events linked to agonist-induced cell migration. We found that cell adhesion was not affected by depletion of any of the proteins of the GIT complex, whereas agonist-enhanced cell spreading was inhibited. Analysis of agonist-stimulated haptotactic cell migration indicated a specific positive effect of GIT1 depletion on trans-well migration. The internalization of the formyl-peptide receptor was also inhibited by depletion of GIT1 and GIT2. The effects of the GIT complexes on trafficking of the receptors was confirmed by an antibody-enhanced agonist-induced internalization assay, showing that depletion of PIX, GIT1 or GIT2 protein caused decreased perinuclear accumulation of internalized receptors.

Conclusions: Our results show that endogenous GIT complexes are involved in the regulation of chemoattractant-induced cell motility and receptor trafficking, and support previous findings indicating an important function of the GIT complexes in the regulation of different G-protein-coupled receptors. Our results also indicate that endogenous GIT1 and GIT2 regulate distinct subsets of agonist-induced responses and suggest a possible functional link between the control of receptor trafficking and the regulation of cell motility by GIT proteins.


Figures
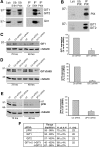
Figure 1
Figure 1. Expression in RBL-FPR cells and down-regulation by siRNAs of endogenous GIT and PIX proteins
(A) Protein lysates (1 mg) from RBL-FPR cells were incubated with Protein A–Sepharose beads with no antibody (Ctr), coupled with SI-64 immune serum (SI64) or pre-immune serum (PI64). Immunoprecipitates (IP), fractions of unbound material (Ub, 1/5 of total) and lysates (Lys; 200 μg) were subjected to SDS/PAGE, and filters were then incubated for immunoblotting with the antibodies specific for the proteins indicated on the right: a mAb recognizing both GIT1 and GIT2 (upper panels) or a polyclonal antibody specific for GIT1 (lower panels). The upper band is GIT1 (asterisk), whereas the lower bands are different variants of GIT2 (arrow). (B) Immunoprecipitate with anti-PIX pAb, lysate and unbound fraction blotted for PIX and the GIT proteins. (CE) RBL-FPR cells were transfected with siRNAs specific for rat GIT1 (C), GIT2 (D) or βPIX (E). Transfections with a control siRNA (Ctr, for luciferase) and non-transfected cells (NT) were included in each experiment. At 48 or 72 h after transfection, cells were lysed in SDS/PAGE loading buffer and immunoblotted with antibodies for GIT1 (C), GIT1 and GIT2 (D) and PIX (E). Quantification of protein down-regulation by the specific versus control siRNAs at 48 h after transfection is shown on the right of each panel. Results are are means±S.D. for three independent experiments. (F) Quantification of protein depletion by the different siRNAs used in the present study. Percentages refer to the level of protein expression evaluated 48 h after electroporation and compared with control cells (electroporated with siRNA for luciferase) taken as 100%. m, mean; n. exp., number of experiments.
Figure 2
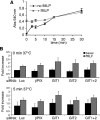
Figure 2. Depletion of GIT and PIX proteins does not affect fMLP-induced cell adhesion to FN
(A) Quantification of RBL-FPR cell adhesion to FN. Cells were stimulated with 100 nM fMLP and centrifuged for 1 min at room temperature (zero time). Cells were then allowed to adhere at 37°C for the indicated times. Each point is the mean for at least four samples per experiment (analysis from three experiments). Adhesion after 0 min at 37°C corresponded to an approx. 2 min incubation at room temperature (see the Materials and methods section). (B) RBL-FPR cells transfected with the indicated siRNAs were resuspended with or without 100 nM fMLP, centrifuged for 1 min at room temperature on FN-coated wells, and incubated for up to 10 min at 37°C before processing. Adhesion is expressed as fold increase with respect to basal adhesion of cells with control siRNA (luciferase). No significant differences in the adhesion to FN were observed between cells transfected with specific or control siRNAs, both under basal and stimulated conditions. Results are means±S.E.M. for three different experiments (two for GIT1+GIT2), with four wells per condition per experiment.
Figure 3
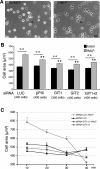
Figure 3. Depletion of either PIX or GIT proteins inhibits fMLP-induced spreading on FN
(A) Phase-contrast images of RBL-FPR cells incubated with or without 100 nM fMLP and allowed to adhere for 15 min on FN. Scale bar, 40 μm. (B) RBL-FPR cells with or without 100 nM fMLP were centrifuged for 1 min at room temperature and allowed to spread for 10 min on FN-coated coverslips before fixation. Phase-contrast images were analysed with ImageJ software to measure the projected cell areas. Results are means±S.E.M. (300–400 cells per experimental condition, from 3–4 independent experiments). **P<0.005. Black asterisks refer to comparisons of the fMLP-induced cell area between control (LUC) and GIT- or PIX-depleted cells; grey asterisks refer to comparisons between basal and fMLP-induced areas for each specific siRNA. (C) Projected areas of cells transfected with the indicated siRNA (mean±S.E.M.; n=50 cells per condition) were measured after spreading for 10–40 min on FN at 37°C with or without stimulation (100 nM fMLP).
Figure 4
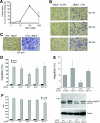
Figure 4. Down-regulation of GIT1 affects fMLP-induced chemotaxis
(A) Directional migration of RBL-FPR cells towards fMLP. Serum-starved RBL-FPR cells were subjected to chemotactic assay towards different concentrations of fMLP for 4 h at 37°C. Cells migrating to the lower side of FN-coated filters were quantified by densitometric analysis. Chemotaxis was calculated as the percentage of maximal chemotactic response (observed at 100 nM fMLP). Means±S.D. for two independent experiments, each performed in duplicate. (B) Coating with FN is required for fMLP-induced migration. Crystal Violet-stained representative fields after transwell migration of RBL-FPR cells for the indicated times are shown. (C) Representative fields after transwell migration towards FN, with or without 100 nM fMLP. Scale bars, 200 μm. (D) RBL-FPR cells transfected with the indicated siRNAs were used for transwell migration assays (2 h at 37°C) in the presence of FN. Directional motility in the presence (grey bars) or absence (black bars) of 100 nM fMLP was expressed as a percentage compared with stimulated control cells (100%=siRNA luciferase+fMLP). Results are mean percentages±S.E.M. of migrated cells per field (n=4 experiments; quantifications from eight fields from two different filters per sample per experiment). siRNA for GIT1 significantly reduced the fMLP-induced migration by 40±6% (S.E.M.; *P<0.05). (E) RBL-FPR cells were co-transfected with the indicated siRNAs and plasmids, and analysed for fMLP-stimulated migration as in (D). Results are mean percentages±S.D. (n=3). The panel under the graph shows an example of a filter from a gel loaded with equal amounts of lysates from the different transfections, incubated with antibodies to detect endogenous and overexpressed GIT proteins (upper panel) or tubulin antibodies (lower panel). (F) Depletion of the components of the endogenous GIT–PIX complexes does not affect calcium response to fMLP. siRNA-transfected RBL-FPR cells were loaded 48 h after electroporation with Fluo4/AM and monitored for changes in intracellular [Ca2+] before and after stimulation with or without fMLP (100 nM). The maximum relative fluorescence unit (RFU) value registered within 3 min after fMLP addition was considered as the response. None of the tested siRNAs caused any significant effect on fMLP-induced calcium response.
Figure 5
Figure 5. Effects of the depletion of components of the GIT–PIX complexes on fMLP-induced FPR internalization
(A) Flow cytometry after fMLP stimulation to analyse the cell surface expression of HA-tagged FPR in RBL-FPR cells. The setting of the gate was based on cell morphology. FSC, forward scatter; SSC, side angle scatter. (B) Flow cytometry of serum-starved cells stimulated with 100 nM fMLP and incubated at 37°C for the indicated times. Down-regulation of the cell surface receptor was detected as a shift towards the left of the peaks of fluorescence intensity (FL1) after internalization at 37°C. (C) Silencing of GIT1, GIT2 or GIT1+GIT2 inhibited receptor internalization. Cells transfected with the indicated siRNAs were incubated at 37°C with fMLP for the indicated times before quantification of the residual receptors at the cell surface by cytofluorimetry. Results are means±S.E.M. (n=3–4 experiments; normalized for each population of transfected cells with respect to the surface receptors at zero time=100%). (D) Percentage of FPR internalized after incubation with fMLP for 10 min at 37°C. (E) Decreased expression of cell surface FPR 48 h after siRNA for βPIX, GIT1, GIT2 or GIT1+GIT2, compared with control siRNA (means±S.E.M. for 3–4 experiments). *P<0.05, **P<0.005 (Student's t test).
Figure 6
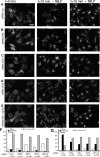
Figure 6. Inhibition of fMLP-induced FPR internalization by siRNA for GIT and PIX
(AE) Immunofluorescence showing three-dimensional projections from stacks of confocal images of cells transfected with the indicated siRNAs and prelabelled at 0°C with anti-HA and Alexa Fluor® 568-conjugated anti-mouse Ig, before incubation at 37°C for the indicated times with or without fMLP. Scale bar, 20 μm. (F, G) Quantification from fluorescence images, shown in (AE), of the distribution of FPR after incubation of antibody-labelled, siRNA-transfected cells for 10 min at 37°C, either in the absence (F) or in the presence of fMLP (G). Numbers indicate the number of cells examined from three independent experiments.

Similar articles

Cited by

References

    1. Albertinazzi C., Za L., Paris S., de Curtis I. ADP-ribosylation factor 6 and a functional PIX/p95-APP1 complex are required for Rac1B-mediated neurite outgrowth. Mol. Biol. Cell. 2003;14:1295–1307. - PMC - PubMed
    1. Ali H., Sozzani S., Fisher I., Barr A.J., Richardson M., Haribabu B., Snyderman R. Differential regulation of formyl peptide and platelet-activating factor receptors. Role of phospholipase Cbeta3 phosphorylation by protein kinase A. J. Biol. Chem. 1998;273:11012–11016. - PubMed
    1. Bagrodia S., Taylor S.J., Jordon K.A., Van Aelst L., Cerione R.A. A novel regulator of p21-activated kinases. J. Biol. Chem. 1998;273:23633–23636. - PubMed
    1. Botrugno O.A., Paris S., Za L., Gualdoni S., Cattaneo A., Bachi A., de Curtis I. Characterization of the endogenous GIT1-betaPIX complex, and identification of its association to membranes. Eur. J. Cell Biol. 2006;85:35–46. - PubMed
    1. Bretscher M.S., Aguado-Velasco C. EGF induces recycling membrane to form ruffles. Curr. Biol. 1998;8:721–724. - PubMed

Publication types

LinkOut - more resources