Genome-wide dynamics of chromatin binding of estrogen receptors alpha and beta: mutual restriction and competitive site selection
- PMID: 19897598
- PMCID: PMC2802902
- DOI: 10.1210/me.2009-0252
Genome-wide dynamics of chromatin binding of estrogen receptors alpha and beta: mutual restriction and competitive site selection
Abstract
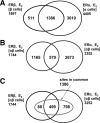
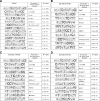
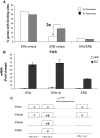
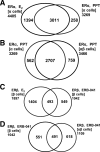
Estrogen receptors ERalpha and ERbeta, members of the nuclear receptor superfamily, exert profound effects on the gene expression and biological response programs of their target cells. Herein, we explore the dynamic interplay between these two receptors in their selection of chromatin binding sites when present separately or together in MCF-7 breast cancer cells. Treatment of cells (containing ERalpha only, ERbeta only, or ERalpha and ERbeta) with estradiol or ER subtype-selective ligands was followed by chromatin immunoprecipitation analysis with a custom-designed tiling array for ER binding sites across the genome to examine the effects of ligand-occupied and unoccupied ERalpha and ERbeta on chromatin binding. There was substantial overlap in binding sites for these estradiol-liganded nuclear receptors when present alone, but many fewer sites were shared when both ERs were present. Each ER restricted the binding site occupancy of the other, with ERalpha generally being dominant. Binding sites of both receptors were highly enriched in estrogen response element motifs, but when both ERs were present, ERalpha displaced ERbeta, shifting it into new sites less enriched in estrogen response elements. Binding regions of the two ERs also showed differences in their enrichments for other transcription factor binding motifs. Studies with ER subtype-specific ligands revealed that it was the liganded subtype that principally determined the spectrum of chromatin binding. These findings highlight the dynamic interplay between the two ERs in their selection of chromatin binding sites, with competition, restriction, and site shifting having important implications for the regulation of gene expression by these two nuclear receptors.
Figures


Similar articles
-
Estrogen Receptors alpha and beta as determinants of gene expression: influence of ligand, dose, and chromatin binding.Mol Endocrinol. 2008 May;22(5):1032-43. doi: 10.1210/me.2007-0356. Epub 2008 Feb 7. Mol Endocrinol. 2008. PMID: 18258689 Free PMC article.
-
Global analysis of estrogen receptor beta binding to breast cancer cell genome reveals an extensive interplay with estrogen receptor alpha for target gene regulation.BMC Genomics. 2011 Jan 14;12:36. doi: 10.1186/1471-2164-12-36. BMC Genomics. 2011. PMID: 21235772 Free PMC article.
-
Binding of estrogen receptor beta to estrogen response element in situ is independent of estradiol and impaired by its amino terminus.Mol Endocrinol. 2005 Nov;19(11):2696-712. doi: 10.1210/me.2005-0120. Epub 2005 Jun 23. Mol Endocrinol. 2005. PMID: 15976006
-
Regulation of specific target genes and biological responses by estrogen receptor subtype agonists.Curr Opin Pharmacol. 2010 Dec;10(6):629-36. doi: 10.1016/j.coph.2010.09.009. Epub 2010 Oct 14. Curr Opin Pharmacol. 2010. PMID: 20951642 Free PMC article. Review.
-
Estrogen signaling via estrogen receptor {beta}.J Biol Chem. 2010 Dec 17;285(51):39575-9. doi: 10.1074/jbc.R110.180109. Epub 2010 Oct 18. J Biol Chem. 2010. PMID: 20956532 Free PMC article. Review.
Cited by
-
Doxorubicin influences the expression of glucosylceramide synthase in invasive ductal breast cancer.PLoS One. 2012;7(11):e48492. doi: 10.1371/journal.pone.0048492. Epub 2012 Nov 2. PLoS One. 2012. PMID: 23133636 Free PMC article.
-
Estrogen Receptor-β and the Insulin-Like Growth Factor Axis as Potential Therapeutic Targets for Triple-Negative Breast Cancer.Crit Rev Oncog. 2015;20(5-6):373-90. doi: 10.1615/CritRevOncog.v20.i5-6.100. Crit Rev Oncog. 2015. PMID: 27279236 Free PMC article. Review.
-
Sharing the Roles: An Assessment of Japanese Medaka Estrogen Receptors in Vitellogenin Induction.Environ Sci Technol. 2016 Aug 16;50(16):8886-95. doi: 10.1021/acs.est.6b01968. Epub 2016 Jul 26. Environ Sci Technol. 2016. PMID: 27391190 Free PMC article.
-
Dense collagen-I matrices enhance pro-tumorigenic estrogen-prolactin crosstalk in MCF-7 and T47D breast cancer cells.PLoS One. 2015 Jan 21;10(1):e0116891. doi: 10.1371/journal.pone.0116891. eCollection 2015. PLoS One. 2015. PMID: 25607819 Free PMC article.
-
Morpholino-mediated knockdown of ERα, ERβa, and ERβb mRNAs in zebrafish (Danio rerio) embryos reveals differential regulation of estrogen-inducible genes.Endocrinology. 2013 Nov;154(11):4158-69. doi: 10.1210/en.2013-1446. Epub 2013 Aug 8. Endocrinology. 2013. PMID: 23928376 Free PMC article.
References
-
- Nilsson S, Mäkelä S, Treuter E, Tujague M, Thomsen J, Andersson G, Enmark E, Pettersson K, Warner M, Gustafsson JA 2001 Mechanisms of estrogen action. Physiol Rev 81:1535–1565 - PubMed
-
- Chang EC, Frasor J, Komm B, Katzenellenbogen BS 2006 Impact of estrogen receptor β on gene networks regulated by estrogen receptor α in breast cancer cells. Endocrinology 147:4831–4842 - PubMed
Publication types
MeSH terms
Substances
Grants and funding
LinkOut - more resources
Full Text Sources
Research Materials
Miscellaneous

