

Structure of the LKB1-STRAD-MO25 complex reveals an allosteric mechanism of kinase activation
- PMID: 19892943
- PMCID: PMC3518268
- DOI: 10.1126/science.1178377
Structure of the LKB1-STRAD-MO25 complex reveals an allosteric mechanism of kinase activation
Abstract
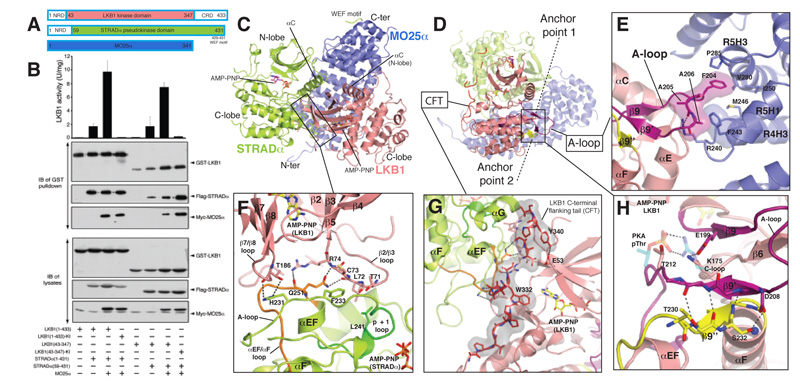
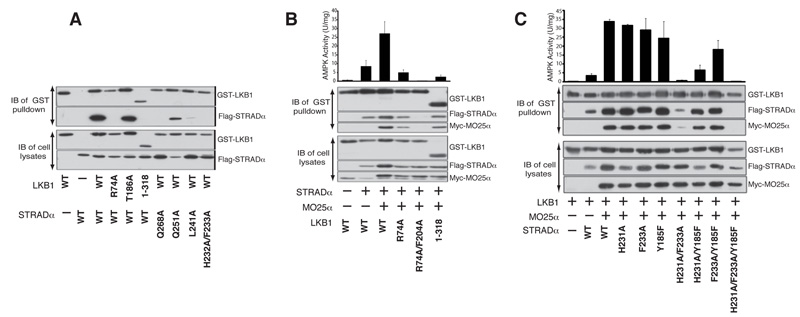
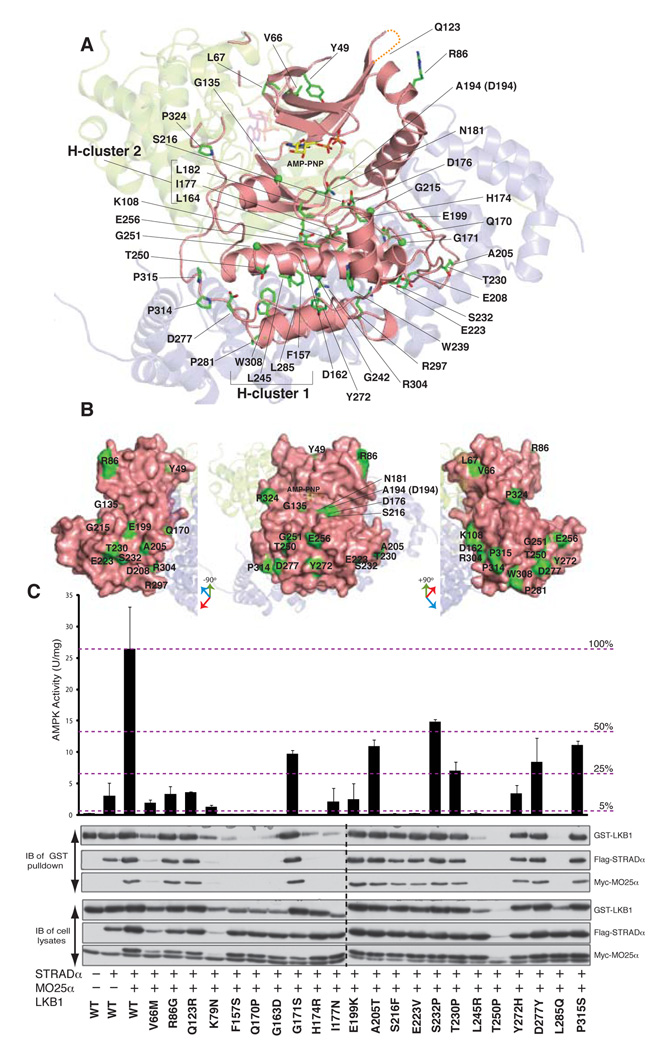
The LKB1 tumor suppressor is a protein kinase that controls the activity of adenosine monophosphate-activated protein kinase (AMPK). LKB1 activity is regulated by the pseudokinase STRADalpha and the scaffolding protein MO25alpha through an unknown, phosphorylation-independent, mechanism. We describe the structure of the core heterotrimeric LKB1-STRADalpha-MO25alpha complex, revealing an unusual allosteric mechanism of LKB1 activation. STRADalpha adopts a closed conformation typical of active protein kinases and binds LKB1 as a pseudosubstrate. STRADalpha and MO25alpha promote the active conformation of LKB1, which is stabilized by MO25alpha interacting with the LKB1 activation loop. This previously undescribed mechanism of kinase activation may be relevant to understanding the evolution of other pseudokinases. The structure also reveals how mutations found in Peutz-Jeghers syndrome and in various sporadic cancers impair LKB1 function.
Figures
Similar articles
-
ATP and MO25alpha regulate the conformational state of the STRADalpha pseudokinase and activation of the LKB1 tumour suppressor.PLoS Biol. 2009 Jun 9;7(6):e1000126. doi: 10.1371/journal.pbio.1000126. Epub 2009 Jun 9. PLoS Biol. 2009. PMID: 19513107 Free PMC article.
-
Analysis of the LKB1-STRAD-MO25 complex.J Cell Sci. 2004 Dec 15;117(Pt 26):6365-75. doi: 10.1242/jcs.01571. Epub 2004 Nov 23. J Cell Sci. 2004. PMID: 15561763
-
MO25alpha/beta interact with STRADalpha/beta enhancing their ability to bind, activate and localize LKB1 in the cytoplasm.EMBO J. 2003 Oct 1;22(19):5102-14. doi: 10.1093/emboj/cdg490. EMBO J. 2003. PMID: 14517248 Free PMC article.
-
Allosteric protein kinase regulation by pseudokinases: insights from STRAD.Sci Signal. 2010 Mar 2;3(111):pe8. doi: 10.1126/scisignal.3111pe8. Sci Signal. 2010. PMID: 20197543 Review.
-
LKB1-dependent signaling pathways.Annu Rev Biochem. 2006;75:137-63. doi: 10.1146/annurev.biochem.75.103004.142702. Annu Rev Biochem. 2006. PMID: 16756488 Review.
Cited by
-
Small molecule stabilization of the KSR inactive state antagonizes oncogenic Ras signalling.Nature. 2016 Sep 1;537(7618):112-116. doi: 10.1038/nature19327. Epub 2016 Aug 24. Nature. 2016. PMID: 27556948 Free PMC article.
-
Functional Role of Histidine in the Conserved His-x-Asp Motif in the Catalytic Core of Protein Kinases.Sci Rep. 2015 May 11;5:10115. doi: 10.1038/srep10115. Sci Rep. 2015. PMID: 25960268 Free PMC article.
-
Increased dietary fat contributes to dysregulation of the LKB1/AMPK pathway and increased damage in a mouse model of early-stage ethanol-mediated steatosis.J Nutr Biochem. 2013 Aug;24(8):1436-45. doi: 10.1016/j.jnutbio.2012.12.002. Epub 2013 Mar 1. J Nutr Biochem. 2013. PMID: 23465594 Free PMC article.
-
Functional insights into the activation mechanism of Ste20-related kinases.Cell Physiol Biochem. 2011;28(6):1219-30. doi: 10.1159/000335854. Epub 2011 Dec 16. Cell Physiol Biochem. 2011. PMID: 22179010 Free PMC article.
-
Rap2A links intestinal cell polarity to brush border formation.Nat Cell Biol. 2012 Aug;14(8):793-801. doi: 10.1038/ncb2537. Epub 2012 Jul 15. Nat Cell Biol. 2012. PMID: 22797597
References
Publication types
MeSH terms
Substances
Associated data
- Actions
Grants and funding
LinkOut - more resources
Full Text Sources
Other Literature Sources
Molecular Biology Databases
