. 2009 Oct 29:9:27.
doi: 10.1186/1475-2867-9-27.

Stimulation of glioma cell motility by expression, proteolysis, and release of the L1 neural cell recognition molecule

Affiliations

Stimulation of glioma cell motility by expression, proteolysis, and release of the L1 neural cell recognition molecule

Muhua Yang et al. Cancer Cell Int. .

Abstract

Background: Malignant glioma cells are particularly motile and can travel diffusely through the brain parenchyma, apparently without following anatomical structures to guide their migration. The neural adhesion/recognition protein L1 (L1CAM; CD171) has been implicated in contributing to stimulation of motility and metastasis of several non-neural cancer types. We explored the expression and function of L1 protein as a stimulator of glioma cell motility using human high-grade glioma surgical specimens and established rat and human glioma cell lines.

Results: L1 protein expression was found in 17 out of 18 human high-grade glioma surgical specimens by western blotting. L1 mRNA was found to be present in human U-87/LacZ and rat C6 and 9L glioma cell lines. The glioma cell lines were negative for surface full length L1 by flow cytometry and high resolution immunocytochemistry of live cells. However, fixed and permeablized cells exhibited positive staining as numerous intracellular puncta. Western blots of cell line extracts revealed L1 proteolysis into a large soluble ectodomain (~180 kDa) and a smaller transmembrane proteolytic fragment (~32 kDa). Exosomal vesicles released by the glioma cell lines were purified and contained both full-length L1 and the proteolyzed transmembrane fragment. Glioma cell lines expressed L1-binding alphavbeta5 integrin cell surface receptors. Quantitative time-lapse analyses showed that motility was reduced significantly in glioma cell lines by 1) infection with an antisense-L1 retroviral vector and 2) L1 ectodomain-binding antibodies.

Conclusion: Our novel results support a model of autocrine/paracrine stimulation of cell motility in glioma cells by a cleaved L1 ectodomain and/or released exosomal vesicles containing L1. This mechanism could explain the diffuse migratory behavior of high-grade glioma cancer cells within the brain.


Figures

Figure 1
Figure 1
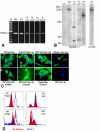
Characterization of human primary glioma surgical samples. Extensive GFAP (A, left panel) expression was detected in primary glioma surgical sample frozen sections using immunofluorescent staining with a rabbit anti-GFAP antibody. (B, left panel) Numerous dividing cells were detected in the same surgical glioma sample using an anti-Ki67 antibody. Right panels in (A) and (B) are nuclear counterstaining for GFAP and Ki67 stained sections, respectively. (C) Demonstration of specificity of anti-L1 antibodies anti-cytoplasmic polyclonal NCAM-L1 (left panel) and anti-ectodomain monoclonal UJ127 (right panel) by western blot analysis. Human L1-expressing quail QT6 cells (QT6/hFL1) were used as positive controls (PC), untransfected QT6 cells were used as negative controls (NC), and plain QT6 cell culture media (M) was used as an additional negative control. (D) L1 expression was found in human primary gliomas surgical samples (sample numbers 10-15 and 17-20) by western blot analysis using UJ127 anti-L1 antibody. Transfected QT6/hFL1 cells were used as positive control and QT6 cells were used as a negative control. Gels were loaded with 10 μg total protein and probed for GAPDH as a loading control (see text). (E) Analysis of surgical samples 18-20 using anti-L1 antibody NCAM-L1. Same blot was used as for (D, right panel, 10 μg total protein/well). GAPDH was used as a loading control. (F) Analysis of glioma surgical samples for L1 protease ADAM10, revealing that all samples were positive predominantly for active ADAM10 (approx. 55 kDa). (G) Surgical samples # 7, 18, 19, and 20 were analyzed by western blot with a rabbit anti-NF-M antibody to detect neurofilament expression. Adult rat brain (RB) lysate was used as a positive control for NF-M staining. (H) Media from surgical sample cells grown in culture were analyzed by western blot for L1. Soluble L1 was detectable in media from sample # 21. Positive controls (PC) were cell lysates from QT6/hFL1 cells, and untransfected cell lysate was used as negative control (NC). Media from CHO cells transfected with an L1 ectodomain vector (CHO-L1ecto) were also used as a positive control for soluble L1. Media from untransfected CHO cells were used as a negative control.
Figure 2
Figure 2
L1 is expressed and proteolyzed in glioma cell lines. (A) RT-PCR was performed on glioma cell lines to detect L1 mRNA. PCR primers were designed as described to generate a 461 bp L1 PCR product. Rat glioma cell lines C6, C6/LacZ, C6/LacZ7, 9L/NgCAM, 9L/LacZ exhibited the 461 bp band after RT-PCR. Rat brain (RB) served as a positive control for L1 mRNA expression. No-reverse transcriptase control reactions were run for every sample, and bands were not present in those lanes (not shown). (B) Western blot analysis of L1 expression. NCAM-L1 antibody (left panel) recognized L1 in rat glioma cell line 9L/LacZ, C6/LacZ7, and human glioma U87/LacZ cells and resulted in lower than full length bands. The approximate weight 32 kDa band indicates proteolysis by ADAM10 in all 3 cell lines. Further proteolysis in 9L/LacZ and U-87/LacZ cells is indicated by additional bands of lower than 200 kDa. Plain quail QT6 and mouse L1-expressing QT6 cells were used as negative and positive controls, respectively. Antibody UJ127 (right panel) against human L1 ectodomain was used for analysis of L1 in U87/LacZ human glioma cell line to determine if the complete ADAM10 ectodomain cleavage product was present, and the large fragment (approx. 220 kDa) indicates its presence. (C) Rat glioma cell lines C6, 9L/LacZ and the human glioma cell line U87/LacZ were immunostained on coverslips with anti-L1 antibodies. Lagenaur polyclonal and NCAM-L1 revealed bright punctate intracellular staining for L1 in fixed and permeablized cells in all 3 cell lines but surface staining was not detectable. Small punctate staining could be visualized on the level of the coverslip outside the cell boundaries when U87/LacZ cells were stained live using Lagenaur (lower middle-left panel). The lower middle-right panel is a higher magnification of upper right panel. The two rightmost panels show quail QT6 transfected with mouse L1 cDNA (top right) or untransfected QT6 (bottom right) immunostained live with the Lagenaur polyclonal antibody, with 3 bright surface stained transfected cells (top right). (D) FACS analyses of fixed (left two panels) and live (right two panels) cells. Fixed and permeablized cells exhibited distinct positive peaks of L1 immunofluorescence compared to no-primary control cells. However, live cells exhibited nearly identical fluorescence profiles to the no-primary control cells indicating little, if any, cell surface L1.
Figure 3
Figure 3
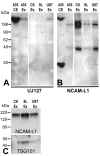
L1 is present in exosomes. Rat and human glioma cells were cultured in serum-free media overnight and the media was put through 3 rounds of centrifugation as described to isolate exosomes. The resulting pellets were resuspended and analyzed by western blot with anti-L1 antibodies UJ127 and NCAM-L1. Full-length L1 was detected in exosomes released only from U87/LacZ human glioma cell line using UJ127 (A), whereas smaller weight proteolyzed forms were detected in exosomes from all 3 cell lines using NCAM-L1 (B). The 32 kDa transmembrane fragment was detected only in U-87/LacZ exosomes (B). A cell extract (435 CE) and exosome preparation (435 Ex) from human breast cancer cell line MDA-MB-435 served as a positive control for L1 detection in cells and exosomes. Exosome preps were analyzed for exosomal marker Tsg101 as well as for L1 in (C). Each exosome preparation showed the predicted 45 kDa band for TSG101.
Figure 4
Figure 4
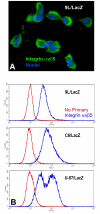
L1-binding integrin expression. (A) 9L/LacZ cells were immunostained live with a mouse monoclonal antibody against integrin αvβ5 (green) and nuclei were counterstained with bisbenzimide (blue). Cell surface staining for integrin αvβ5 is clearly visible. (B) Rat glioma cells 9L/LacZ and C6/LacZ and human glioma cells U87/LacZ were immunostained live for integrin αvβ5 and analyzed by flow cytometry. All 3 cell lines exhibited distinct positive peaks for integrin αvβ5 (blue lines) compared to no primary antibody negative controls (red lines), and U87/LacZ cells appeared to have two overlapping positive populations: one high-level positive population and another lower-lever positive population.
Figure 5
Figure 5
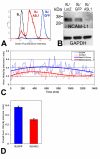
L1-attenuated glioma cells were less motile. (A) 9L/LacZ cells were infected with mouse antisense-L1 retroviral vector or control pLEGFP-C1 vector. The positively infected cells were then sorted by FACS. Post-sort analysis of live cells is shown with fluorescence intensity level displayed along the X-axis. The black peak represents uninfected cells, the blue line represents pLEGFP-C1 vector infected negative control cells (96% infected), and the red line represent the cells infected with antisense-L1 vector (87% infected). Antisense-L1 infected cells were less bright green than the extremely bright control GFP-only cells, presumably because of fusion of GFP to the antisense sequences. (B) L1 expression was analyzed by western blot in vector infected 9L cells purified above. Whole cell lysates were made and the same amount of total protein was loaded into each lane (30 μg). Western blots were stained with NCAM-L1 polyclonal anti-cytoplasmic L1 and the density of the 32 kDa cytoplasmic L1 fragment was analyzed using Un-Scan-It software. The 32 kDa cytoplasmic fragment was reduced by approximately 90% in the antisense infected 9L/ASL1 cells compared to the 9L/GFP negative control cells. Blots were probed for GAPDH, which was used to normalize protein levels for quantitation of L1. (C) Cells were assessed by the Super Scratch assay for effects on cell motility. Antisense-L1 infected 9L/lacZ cells showed decreased motility (red graph) compared to pLEGFP infected control cells (blue graph). The time-lapse graph shows the average velocities (thin lines) and 3rd order polynomial best-fit curves (thick lines) of control and antisense-L1 infected populations of cells analyzed above at 15 min. intervals. The average velocity of the antisense-infected cells was consistently lower throughout the time course of the experiment. (D) The overall average velocities were calculated using all individual cell velocities collected during the course of the experiment and graphed as single values for the two populations of cells. Control GFP-only infected cell velocity was 0.381 ± 0.012 s.e.m. and AS-L1 infected cell velocity was 0.253 ± 0.008 s.e.m. The differences in the velocities are highly significant (p < 0.001). The experiment was repeated twice with similar results.
Figure 6
Figure 6
Anti-L1 antibodies and RGD peptide inhibit glioma cell motility. (A) Anti-L1 antibody ASCS4 was added to 9L/LacZ cultures and assessed by the Super Scratch assay for effects on cell motility. The time-lapse graph shows the average velocities and best-fit curves of the control and antibody treated 9L/Lacz cells over a 20 hour time period (15 cells each condition). The antibody ASCS4 consistently lowered the velocities of migrating cells throughout the course of the experiment. (B) The overall average velocities were calculated using all individual cell velocities collected during the course of the experiment and graphed as single values for the two populations of cells. Control cell velocity was 0.073 ± 0.002 μm/min. Velocity of the ASCS4 treated cells was reduced 34% compared to untreated controls at 0.048 ± 0.001 μm/min (p < 0.001). Bars are s.e.m. (C) Anti-L1 antibody EZ1 or the RGD-containing peptide antigen were added to cell cultures as described and assessed by the Super Scratch assay for effects on 9L/LacZ cell motility. The time lapse graph shows the average velocities and best-fit curves of the control, antibody treated, and peptide treated 9L/Lacz cells over a 20 hour time period (2 areas of interest and 40 cells each condition). The antibody EZ1 and peptide consistently lowered the velocities of migrating cells throughout the course of the experiment, with the antibody having a greater effect on reducing migration velocity. (D) The overall average velocity for the three populations of cells from (C) is shown. Control cell velocity was 0.214 ± 0.003 μm/min. Velocity of the EZ1 treated cells was reduced 32% (0.146 ± 0.003 μm/min) and velocity of peptide treated cells was reduced by 19% (0.174 ± 0.003 μm/min) compared to untreated controls (p < 0.001 for each comparison). Bars are s.e.m. Shown are data from one representative experiment. The experiments were repeated twice with similar results.

Similar articles

Cited by

References

    1. Claes A, Idema AJ, Wesseling P. Diffuse glioma growth: a guerilla war. Acta Neuropathol. 2007;114:443–458. doi: 10.1007/s00401-007-0293-7. - DOI - PMC - PubMed
    1. Wen PY, Kesari S. Malignant gliomas in adults. N Engl J Med. 2008;359:492–507. doi: 10.1056/NEJMra0708126. - DOI - PubMed
    1. Laerum OD. Local spread of malignant neuroepithelial tumors. Acta Neurochirurgica. 1997;139:515–522. doi: 10.1007/BF02750993. - DOI - PubMed
    1. Tsuzuki T, Izumoto S, Ohnishi T, Hiraga S, Arita N, Hayakawa T. Neural cell adhesion molecule L1 in gliomas: correlation with TGF-β and p53. J Clin Pathol. 1998;51:13–17. doi: 10.1136/jcp.51.1.13. - DOI - PMC - PubMed
    1. Huszar M, Moldenhauer G, Gschwend V, Ben-Arie A, Altevogt P, Fogel M. Expression profile analysis in multiple human tumors identifies L1 (CD171) as a molecular marker for differential diagnosis and targeted therapy. Hum Pathol . 2006;37:1000–1008. doi: 10.1016/j.humpath.2006.03.014. - DOI - PubMed

LinkOut - more resources