

Regulated cleavage of prothrombin by prothrombinase: repositioning a cleavage site reveals the unique kinetic behavior of the action of prothrombinase on its compound substrate
- PMID: 19858193
- PMCID: PMC2804180
- DOI: 10.1074/jbc.M109.070334
Regulated cleavage of prothrombin by prothrombinase: repositioning a cleavage site reveals the unique kinetic behavior of the action of prothrombinase on its compound substrate
Abstract
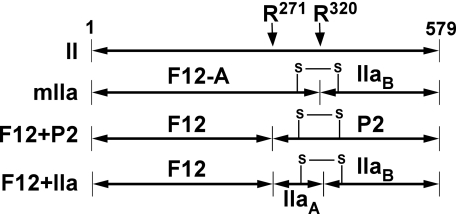
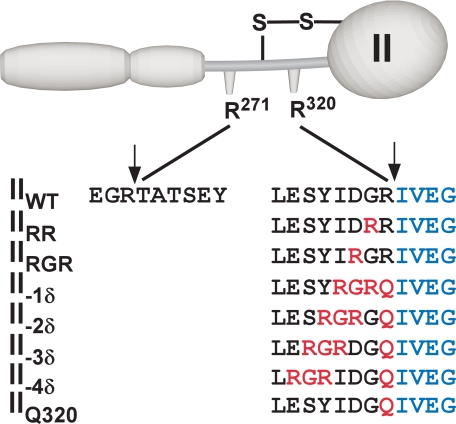
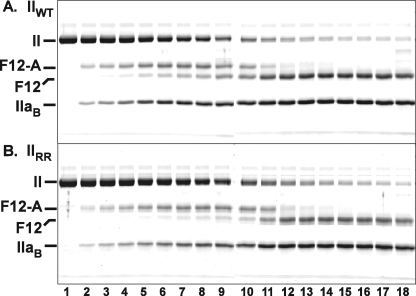
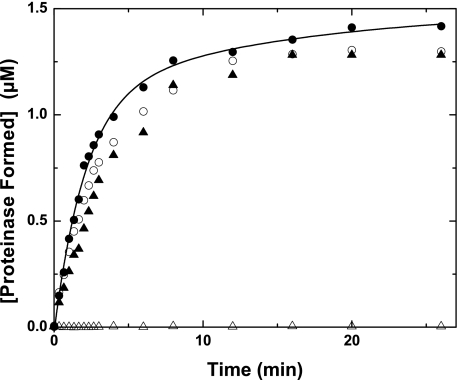
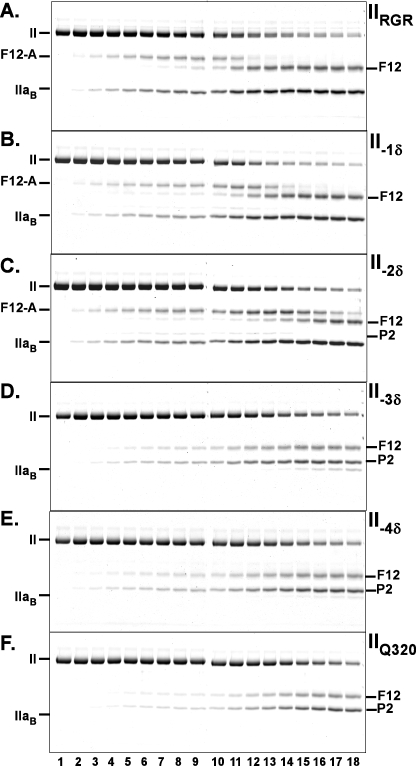
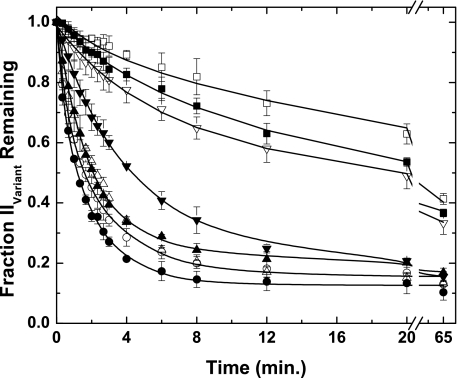
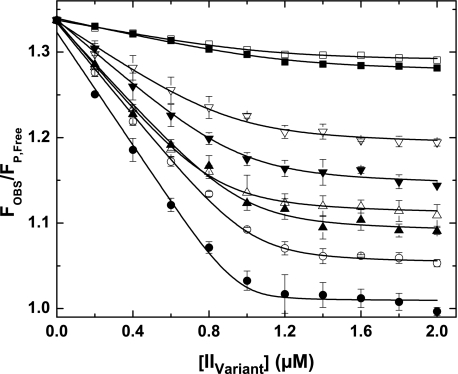
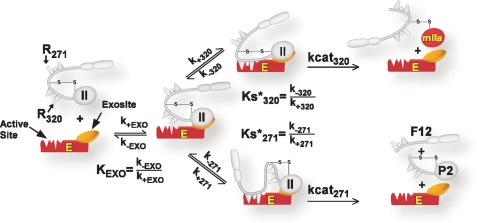
Prothrombinase converts prothrombin to thrombin via cleavage at Arg(320) followed by cleavage at Arg(271). Exosite-dependent binding of prothrombin to prothrombinase facilitates active site docking by Arg(320) and initial cleavage at this site. Precise positioning of the Arg(320) site for cleavage is implied by essentially normal cleavage at Arg(320) in recombinant prothrombin variants bearing additional Arg side chains either one or two residues away. However, mutation of Arg(320) to Gln reveals that prothrombinase can cleave prothrombin following Arg side chains shifted by as many as two residues N-terminal to the 320 position at near normal rates. Further repositioning leads to a loss in cleavage at this region with an abrupt shift toward slow cleavage at Arg(271). In contrast, the binding constant for the active site docking step is strongly dependent on the sequence preceding the scissile bond as well as position. Large effects on binding only yield minor changes in rate until the binding constant passes a threshold value. This behavior is expected for a substrate that can engage the enzyme through mutually exclusive active site docking reactions followed by cleavage to yield different products. Cleavage site specificity as well as the ordered action of prothrombinase on its compound substrate is regulated by the thermodynamics of active site engagement of the individual sites as well as competition between alternate cleavage sites for active site docking.
Figures
Similar articles
-
Binding of substrate in two conformations to human prothrombinase drives consecutive cleavage at two sites in prothrombin.J Biol Chem. 2004 Dec 24;279(52):54927-36. doi: 10.1074/jbc.M410866200. Epub 2004 Oct 19. J Biol Chem. 2004. PMID: 15494418
-
Restricted active site docking by enzyme-bound substrate enforces the ordered cleavage of prothrombin by prothrombinase.J Biol Chem. 2007 Nov 9;282(45):32974-82. doi: 10.1074/jbc.M706529200. Epub 2007 Sep 11. J Biol Chem. 2007. PMID: 17848548 Free PMC article.
-
Exosite binding tethers the macromolecular substrate to the prothrombinase complex and directs cleavage at two spatially distinct sites.J Biol Chem. 2000 Dec 8;275(49):38561-70. doi: 10.1074/jbc.M006637200. J Biol Chem. 2000. PMID: 10984491
-
The transition of prothrombin to thrombin.J Thromb Haemost. 2013 Jun;11 Suppl 1(0 1):265-76. doi: 10.1111/jth.12217. J Thromb Haemost. 2013. PMID: 23809130 Free PMC article. Review.
-
Coagulation factor V: a plethora of anticoagulant molecules.Curr Opin Hematol. 2005 Mar;12(2):141-8. doi: 10.1097/01.moh.0000155016.30296.90. Curr Opin Hematol. 2005. PMID: 15725905 Review.
Cited by
-
Inhibition of thrombin formation by active site mutated (S360A) activated protein C.J Biol Chem. 2010 Jul 23;285(30):22890-900. doi: 10.1074/jbc.M110.131029. Epub 2010 May 18. J Biol Chem. 2010. PMID: 20484050 Free PMC article.
-
Membrane binding by prothrombin mediates its constrained presentation to prothrombinase for cleavage.J Biol Chem. 2013 Sep 27;288(39):27789-800. doi: 10.1074/jbc.M113.502005. Epub 2013 Aug 12. J Biol Chem. 2013. PMID: 23940050 Free PMC article.
-
A bipartite autoinhibitory region within the B-domain suppresses function in factor V.J Biol Chem. 2012 Jul 27;287(31):26342-51. doi: 10.1074/jbc.M112.377168. Epub 2012 Jun 15. J Biol Chem. 2012. PMID: 22707727 Free PMC article.
-
Novel factor VIII variants with a modified furin cleavage site improve the efficacy of gene therapy for hemophilia A.J Thromb Haemost. 2017 Jan;15(1):110-121. doi: 10.1111/jth.13543. Epub 2016 Nov 25. J Thromb Haemost. 2017. PMID: 27749002 Free PMC article.
-
Generation of an anticoagulant aptamer that targets factor V/Va and disrupts the FVa-membrane interaction in normal and COVID-19 patient samples.Cell Chem Biol. 2022 Feb 17;29(2):215-225.e5. doi: 10.1016/j.chembiol.2022.01.009. Epub 2022 Feb 2. Cell Chem Biol. 2022. PMID: 35114109 Free PMC article.
References
-
- Mann K. G., Jenny R. J., Krishnaswamy S. (1988) Annu. Rev. Biochem. 57, 915–956 - PubMed
-
- Mann K. G., Nesheim M. E., Church W. R., Haley P., Krishnaswamy S. (1990) Blood 76, 1–16 - PubMed
-
- Mann K. G. (2003) Chest 124, 4S–10S - PubMed
-
- Camire R. M., Pollack E. S. (2006) in Hemostasis and Thrombosis. Basic Principles and Clinical Practice (Colman R. W., Marder V. J., Clowes A. J., George J. N., Goldhaber S. Z. eds) pp. 59–89, Lippincott Williams & Wilkins, Philadelphia, PA
-
- Krishnaswamy S., Church W. R., Nesheim M. E., Mann K. G. (1987) J. Biol. Chem. 262, 3291–3299 - PubMed
Publication types
MeSH terms
Substances
Grants and funding
LinkOut - more resources
Full Text Sources
