. 2009 Oct 14;29(41):12957-69.
doi: 10.1523/JNEUROSCI.1064-09.2009.

Cognitive decline in Alzheimer's disease is associated with selective changes in calcineurin/NFAT signaling

Affiliations

Cognitive decline in Alzheimer's disease is associated with selective changes in calcineurin/NFAT signaling

Hafiz Mohmmad Abdul et al. J Neurosci. .

Abstract

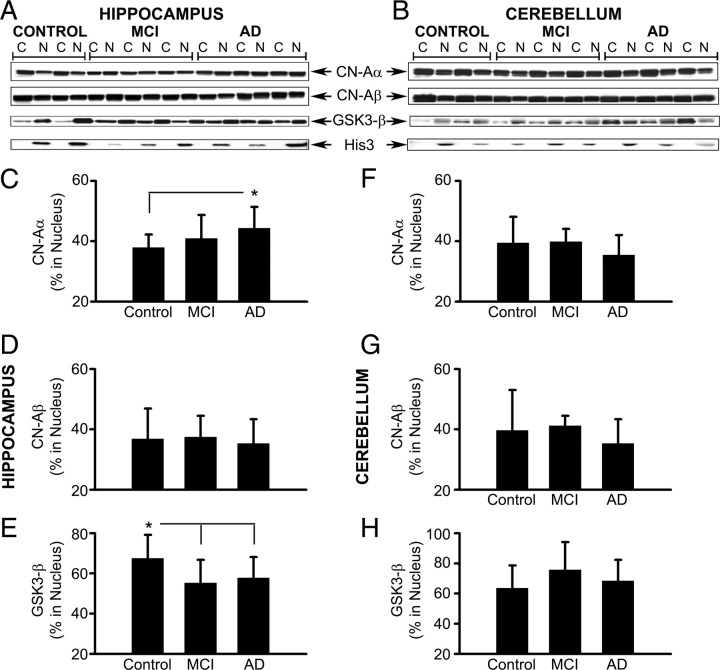
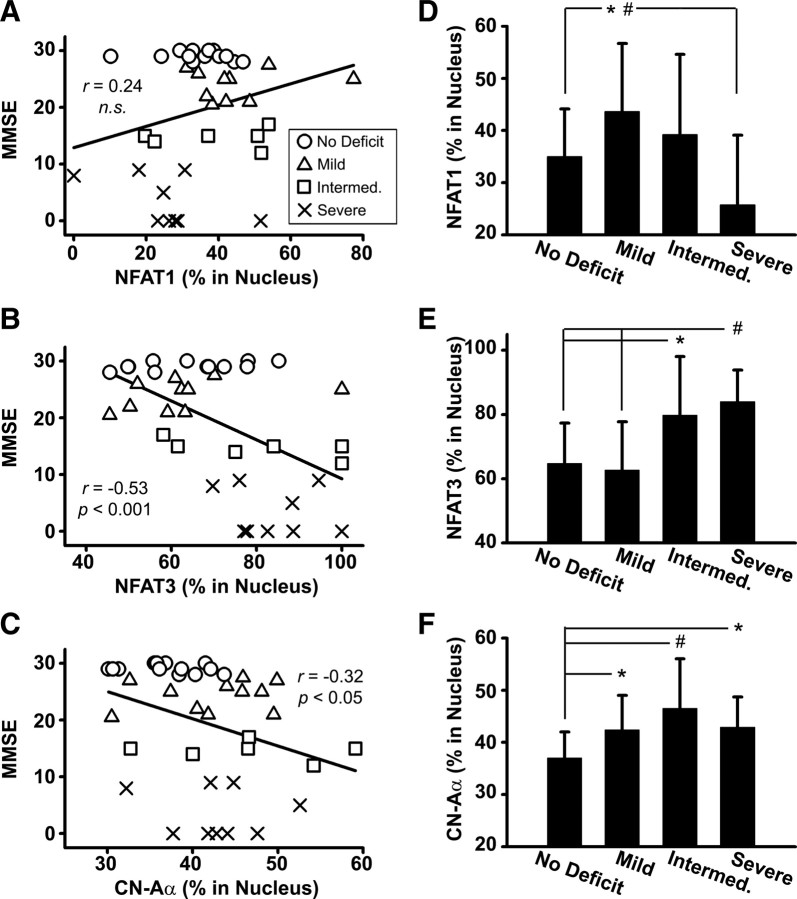
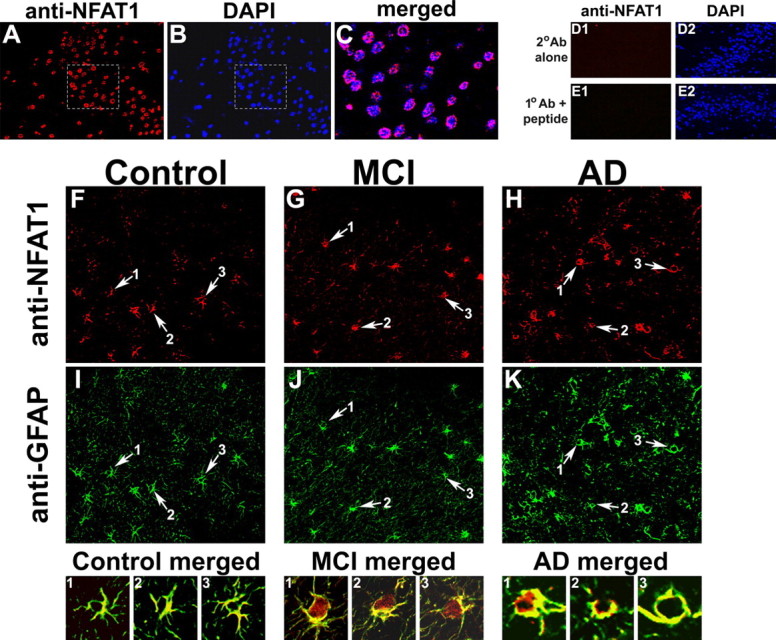
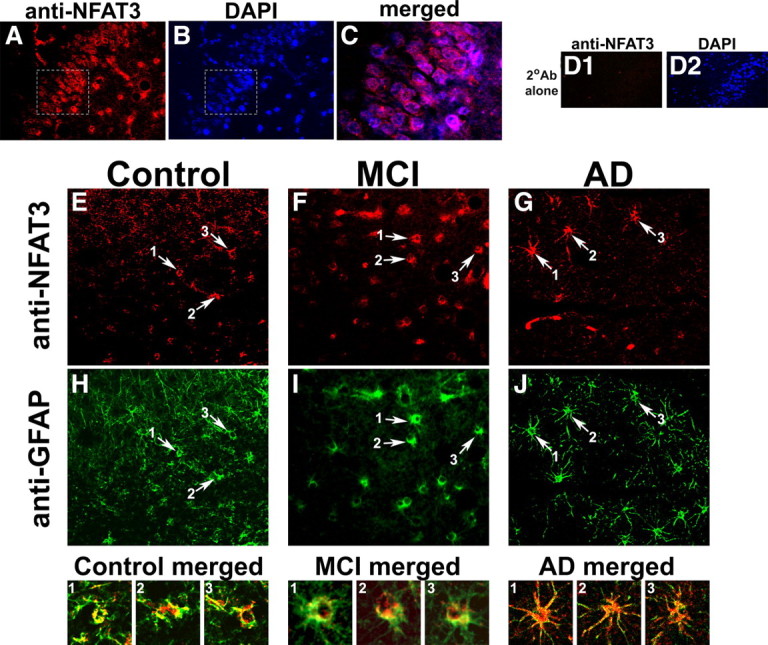
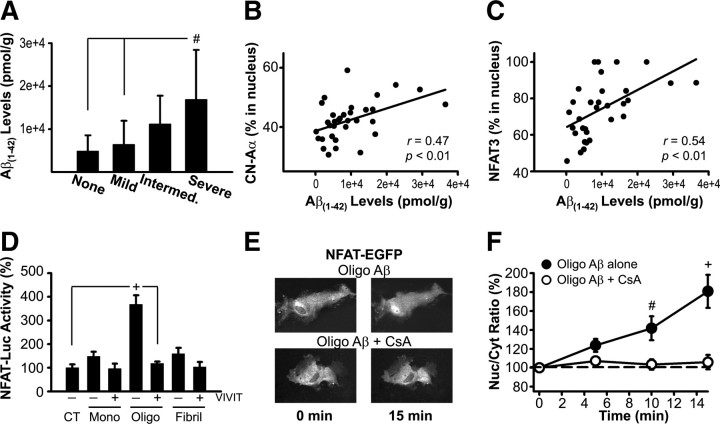
Upon activation by calcineurin, the nuclear factor of activated T-cells (NFAT) translocates to the nucleus and guides the transcription of numerous molecules involved in inflammation and Ca(2+) dysregulation, both of which are prominent features of Alzheimer's disease (AD). However, NFAT signaling in AD remains relatively uninvestigated. Using isolated cytosolic and nuclear fractions prepared from rapid-autopsy postmortem human brain tissue, we show that NFATs 1 and 3 shifted to nuclear compartments in the hippocampus at different stages of neuropathology and cognitive decline, whereas NFAT2 remained unchanged. NFAT1 exhibited greater association with isolated nuclear fractions in subjects with mild cognitive impairment (MCI), whereas NFAT3 showed a strong nuclear bias in subjects with severe dementia and AD. Similar to NFAT1, calcineurin-Aalpha also exhibited a nuclear bias in the early stages of cognitive decline. But, unlike NFAT1 and similar to NFAT3, the nuclear bias for calcineurin became more pronounced as cognition worsened. Changes in calcineurin/NFAT3 were directly correlated to soluble amyloid-beta (Abeta((1-42))) levels in postmortem hippocampus, and oligomeric Abeta, in particular, robustly stimulated NFAT activation in primary rat astrocyte cultures. Oligomeric Abeta also caused a significant reduction in excitatory amino acid transporter 2 (EAAT2) protein levels in astrocyte cultures, which was blocked by NFAT inhibition. Moreover, inhibition of astrocytic NFAT activity in mixed cultures ameliorated Abeta-dependent elevations in glutamate and neuronal death. The results suggest that NFAT signaling is selectively altered in AD and may play an important role in driving Abeta-mediated neurodegeneration.


Figures

Figure 1.
Figure 1.
Isoform- and region-specific changes in the nuclear accumulation of NFATs with MCI and AD. A, B, Representative Western blots for NFATs 1, 2, and 3 in cytosolic (C) and nuclear (N) fractions prepared from hippocampal (A) and cerebellar (B) tissue samples from control, MCI, and AD patients. Histone-3 (His-3) levels were also probed to confirm the purity of nuclear fractions. Note that blots for each protein were derived from different gels. C–H, Percentage of NFAT1, 2, and 3 protein levels (mean ± SD) associated with hippocampal (C–E) and cerebellar (F–H) nuclear fractions from control, MCI, and AD subjects. The results revealed an increase in the association of NFAT1 (C) and NFAT 3 (E) with hippocampal nuclear fractions from MCI, and AD cases, respectively. Relative to hippocampus, changes in NFAT localization in cerebellum were very different. Nuclear accumulation of NFAT1 (F) and NFAT2 (G) was increased, whereas NFAT3 (H) was decreased with AD. I, Western blot of immunoprecipitated NFAT3 from whole hippocampal homogenates from eight control and eight AD subjects labeled with anti-NFAT3 antibodies and anti-phosphoserine antibodies. J, Mean ± SD band intensity (optical density in arbitrary units) of total NFAT3 and phospho-NFAT3 from subjects shown in I. Results showed that the increased nuclear localization of NFAT3 in AD patients is associated with reduced NFAT3 phosphorylation levels. *p < 0.05, #p < 0.01, +p < 0.001.
Figure 2.
Figure 2.
Isoform- and region-specific changes in the nuclear accumulation of CN and GSK3-β with MCI and AD. A, B, Representative Western blots for CN-Aα, CN-Aβ, and GSK3-β in cytosolic (C) and nuclear (N) fractions prepared from hippocampal (A) and cerebellar (B) tissue samples from control, MCI, and AD patients. Histone-3 (His-3) levels were also probed to confirm the purity of nuclear fractions. Note that blots for each protein were derived from different gels. C–H, Percentage of CN-Aα, CN-Aβ, and GSK3-β protein levels (mean ± SD) associated with hippocampal (C–E) and cerebellar (F–H) nuclear fractions from control, MCI, and AD subjects. The results revealed an increase in the association of CN-Aα (C) with hippocampal nuclear fractions with AD. Conversely, the nuclear accumulation of GSK3-β (E) was reduced in the hippocampus with MCI and AD. No significant changes in CN-Aα, CN-Aβ, or GSK3-β were observed in the cerebellum. *p < 0.05.
Figure 3.
Figure 3.
Interrelationships among NFATs, CN, and GSK3-β in hippocampus. Scatter plots illustrate hippocampal nuclear levels (percent in nucleus) for NFAT1 (A–C) and NFAT3 (D–F) plotted against nuclear levels for CN-Aα (A, D), CN-Aβ (B, E), and GSK3-β (C, F) within the same subjects regardless of disease state. Plots were fitted using simple regression analysis. Note that the nuclear accumulation of both NFATs 1 and 3 is directly proportional to nuclear CN-Aα levels (A, D). Conversely, NFAT1, but not NFAT3, also showed a direct correlation to CN-Aβ (B). Neither NFAT isoform showed a significant correlation to GSK3-β. n.s., Not significant.
Figure 4.
Figure 4.
Selective changes in hippocampal CN/NFAT isoforms as cognitive deficits emerge. A–C, Scatter plots illustrate MMSE scores plotted against nuclear levels (percent in nucleus) for NFAT1 (A), NFAT3 (B), and CN-Aα (C). D–F, Percentage (mean ± SD) of NFAT1 (D) NFAT3 (E), and CN-Aα (F) protein levels associated with hippocampal nuclear fractions in subjects exhibiting different degrees of cognitive impairment [no deficit, n = 12; mild, n = 11; intermediate (Intermed.), n = 6; and severe, n = 9]. Nuclear NFAT1 levels showed an initial increase with mild impairment before dropping significantly as cognitive function worsened (D). The precipitous decrease in NFAT1 levels between the mild and severe deficit stages likely accounts for the positive (albeit insignificant) correlation between NFAT1 and MMSE scores (A). In contrast, although nuclear NFAT3 levels showed a strong inverse correlation to MMSE scores (B), it is clear that this elevated nuclear bias did not emerge until cognitive deficits were well advanced (E). The CN-Aα isoform exhibited changes that were similar to both NFATs 1 and 3. As with NFAT1, nuclear CN levels increased in the mildest stages of cognitive decline (F). However, like NFAT 3, nuclear CN-Aα levels continued to increase as cognition worsened. *p < 0.05, #p < 0.01.
Figure 5.
Figure 5.
NFAT1 is expressed in neurons and astrocytes in postmortem human hippocampal tissue. A, B, Confocal immunofluorescent images of dentate gyrus from human AD hippocampal sections showing double labeling for NFAT1 (red) (A) and DAPI counterstain (blue) (B). C, Merged image of the highlighted areas from A and B. The ring-like expression pattern suggests that NFAT1 is primarily distributed in the cytosol of the neurons. D, E, Micrographs of the human dentate gyrus (AD case) show DAPI labeling throughout the neuronal cell body layer, but little to no red fluorescence when secondary antibody is used alone (D1), or when NFAT1 primary antibody is coadministered with an NFAT1 blocking peptide (E1). F–K, Colabeling of representative control (F, I), MCI (G, J), and AD (H, K) sections using antibodies to NFAT1 (F–H) and to GFAP (I–K) for identification of astrocytes. In each panel, arrows point to regions that illustrate colocalization of NFAT1 and GFAP (numbered 1-3), and are provided as high-magnification merged images in the corresponding panels below. Note that NFAT1 is present in both neurons and astrocytes but its localization at the cellular level appears to vary as a function of pathology. Specifically, NFAT1 tends to show greater nuclear accumulation in astrocytes with MCI.
Figure 6.
Figure 6.
NFAT3 is expressed in neurons and astrocytes in postmortem human hippocampal tissue. A, B, Confocal immunofluorescent images of dentate gyrus from human MCI hippocampus sections showing double labeling for NFAT3 (red) (A) and DAPI counterstain (blue) (B). C, Merged image of the highlighted areas from A and B. Results show that NFAT3 is primarily distributed in the cytosol of the neurons. D, Micrographs of the human dentate gyrus (AD case) show DAPI labeling throughout the neuronal cell body layer (D2), but little to no red fluorescence when secondary antibody is used alone (D1). E–J, Colabeling of representative control (E, H), MCI (F, I), and AD (G, J) sections using antibodies to NFAT3 (E–G) and to GFAP (H–J) for identification of astrocytes. In each panel, arrows point to regions that illustrate colocalization of NFAT3 and GFAP (numbered 1-3), and are provided as high-magnification, merged images in the corresponding panels below. Note that NFAT3 is present in both neurons and astrocytes but its localization at the cellular level appears to vary as a function of pathology. Specifically, NFAT3 tends to appear at higher levels throughout astrocytes with AD, and is most intensely expressed in the soma and nucleus.
Figure 7.
Figure 7.
Aβ levels are positively correlated to CN/NFAT signaling in postmortem hippocampus and directly activate NFAT transcriptional activity in primary astrocyte cultures. A, Soluble Aβ(1-42) levels (mean ± SD) in whole hippocampal homogenates from subjects exhibiting different degrees of cognitive impairment [no deficit, n = 12; mild, n = 11; intermediate (Intermed.), n = 6; and severe, n = 9]. As expected, there was a steady increase in Aβ(1-42) levels as the severity of dementia progressed. B, C, Scatter plots illustrate nuclear levels (percent in nucleus) for CN-Aα and NFAT3 plotted against soluble Aβ(1-42) levels, respectively. Nuclear accumulation of both CN-Aα and NFAT3 in human hippocampus increased with increasing Aβ(1-42). D, Mean ± SEM. NFAT-luciferase activity [% control (CT)] in primary rat astrocyte cultures measured after 24 h application of monomeric (Mono), oligomeric (Oligo), or fibrillar (Fibril) Aβ peptides (65–75 nm) in the presence (+) or absence (−) of the potent NFAT inhibitor VIVIT (n = 6–8 dishes per condition). Relative to monomeric and fibrillar Aβ, NFAT-luc activity was stimulated to a far greater extent by Aβ oligomers. E, Representative fluorescent images of NFAT-EGFP expression in individual astrocytes before and 15 min after treatment with oligomeric Aβ in the presence or absence of the CN inhibitor, cyclosporin A (CsA, 5 μm). Redistribution of NFAT-EGFP from the cytosol to the nucleus occurred within minutes of Aβ stimulation. F, Mean ± SEM nuclear/cytosolic (Nuc/Cyt) ratio (percentage at zero time point) of NFAT-EGFP in astrocytes treated with oligomeric Aβ alone (n = 19) or with CsA (n = 10). Results demonstrate a significant increase in the Nuc/cyt ratio of NFAT in astrocytes within 15 min after Aβ treatment. No translocation was observed in cells pretreated with CsA. #p < 0.01, +p < 0.001.
Figure 8.
Figure 8.
Downregulation of EAAT2 protein is associated with elevated glutamate levels and neurotoxicity. A, Representative Western blot and graph for EAAT2 in membrane fractions prepared from hippocampal tissue samples from control, MCI, and AD patients. EAAT2 levels drop off precipitously with MCI and AD. B, Representative Western blot and graph for EAAT2 in primary rat astrocyte cultures that were untreated (control; CT), or incubated for 24 h with oligomeric Aβ (65 nm) in the presence or absence of lipid soluble VIVIT peptide (50 nm). Cultures were treated 2 h with VIVIT before oligomeric Aβ administration (n = 4 pooled samples per condition). Results are expressed as percentage of control (mean ± SEM). Oligomeric Aβ caused an ∼25% reduction in EAAT2 levels, which was blocked by VIVIT. C, D, Extracellular glutamate levels (C) and number of dead neurons (D) after 24–48 h treatment with oligomeric Aβ (65 nm). Cultures were infected 24 h earlier with control adenovirus (Gfa2-EGFP, control) or adenovirus encoding VIVIT (Gfa2-VIVIT). The human GFAP promoter (GFa2) was used to limit transgene expression to astrocytes. Data for C and D are expressed as percentage of the Gfa2-EGFP control condition (mean ± SEM). Under these conditions, oligomeric Aβ caused a marked increase in extracellular glutamate levels and neuronal death that was significantly alleviated by inhibiting astrocytic CN/NFAT activity with VIVIT. *p ≤ 0.05, #p < 0.01, +p < 0.001.

Similar articles

Cited by

References

    1. Abbott KL, Friday BB, Thaloor D, Murphy TJ, Pavlath GK. Activation and cellular localization of the cyclosporine A-sensitive transcription factor NF-AT in skeletal muscle cells. Mol Biol Cell. 1998;9:2905–2916. - PMC - PubMed
    1. Agostinho P, Lopes JP, Velez Z, Oliveira CR. Overactivation of calcineurin induced by amyloid-beta and prion proteins. Neurochem Int. 2008;52:1226–1233. - PubMed
    1. Akama KT, Van Eldik LJ. Beta-amyloid stimulation of inducible nitric-oxide synthase in astrocytes is interleukin-1beta- and tumor necrosis factor-alpha (TNFalpha)-dependent, and involves a TNFalpha receptor-associated factor- and NFkappaB-inducing kinase-dependent signaling mechanism. J Biol Chem. 2000;275:7918–7924. - PubMed
    1. Akama KT, Albanese C, Pestell RG, Van Eldik LJ. Amyloid beta-peptide stimulates nitric oxide production in astrocytes through an NFkappaB-dependent mechanism. Proc Natl Acad Sci U S A. 1998;95:5795–5800. - PMC - PubMed
    1. Aramburu J, Yaffe MB, López-Rodríguez C, Cantley LC, Hogan PG, Rao A. Affinity-driven peptide selection of an NFAT inhibitor more selective than cyclosporin A. Science. 1999;285:2129–2133. - PubMed

Publication types

MeSH terms

LinkOut - more resources