Gabapentin receptor alpha2delta-1 is a neuronal thrombospondin receptor responsible for excitatory CNS synaptogenesis
- PMID: 19818485
- PMCID: PMC2791798
- DOI: 10.1016/j.cell.2009.09.025
Gabapentin receptor alpha2delta-1 is a neuronal thrombospondin receptor responsible for excitatory CNS synaptogenesis
Abstract
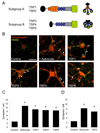
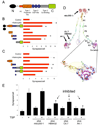
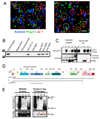
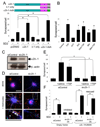
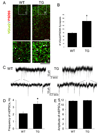
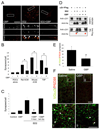
Synapses are asymmetric cellular adhesions that are critical for nervous system development and function, but the mechanisms that induce their formation are not well understood. We have previously identified thrombospondin as an astrocyte-secreted protein that promotes central nervous system (CNS) synaptogenesis. Here, we identify the neuronal thrombospondin receptor involved in CNS synapse formation as alpha2delta-1, the receptor for the anti-epileptic and analgesic drug gabapentin. We show that the VWF-A domain of alpha2delta-1 interacts with the epidermal growth factor-like repeats common to all thrombospondins. alpha2delta-1 overexpression increases synaptogenesis in vitro and in vivo and is required postsynaptically for thrombospondin- and astrocyte-induced synapse formation in vitro. Gabapentin antagonizes thrombospondin binding to alpha2delta-1 and powerfully inhibits excitatory synapse formation in vitro and in vivo. These findings identify alpha2delta-1 as a receptor involved in excitatory synapse formation and suggest that gabapentin may function therapeutically by blocking new synapse formation.
Figures

Similar articles
-
α2δ-1 Signaling Drives Cell Death, Synaptogenesis, Circuit Reorganization, and Gabapentin-Mediated Neuroprotection in a Model of Insult-Induced Cortical Malformation.eNeuro. 2017 Nov 6;4(5):ENEURO.0316-17.2017. doi: 10.1523/ENEURO.0316-17.2017. eCollection 2017 Sep-Oct. eNeuro. 2017. PMID: 29109971 Free PMC article.
-
Thrombospondin-4 reduces binding affinity of [(3)H]-gabapentin to calcium-channel α2δ-1-subunit but does not interact with α2δ-1 on the cell-surface when co-expressed.Sci Rep. 2016 Apr 14;6:24531. doi: 10.1038/srep24531. Sci Rep. 2016. PMID: 27076051 Free PMC article.
-
Astrocyte-derived thrombospondins mediate the development of hippocampal presynaptic plasticity in vitro.J Neurosci. 2012 Sep 19;32(38):13100-10. doi: 10.1523/JNEUROSCI.2604-12.2012. J Neurosci. 2012. PMID: 22993427 Free PMC article.
-
Acute modulation of calcium currents and synaptic transmission by gabapentinoids.Channels (Austin). 2010 Nov-Dec;4(6):490-6. doi: 10.4161/chan.4.6.12864. Epub 2010 Nov 1. Channels (Austin). 2010. PMID: 21150315 Review.
-
The α2δ Subunit and Absence Epilepsy: Beyond Calcium Channels?Curr Neuropharmacol. 2017;15(6):918-925. doi: 10.2174/1570159X15666170309105451. Curr Neuropharmacol. 2017. PMID: 28290248 Free PMC article. Review.
Cited by
-
The role of auxiliary subunits for the functional diversity of voltage-gated calcium channels.J Cell Physiol. 2015 Sep;230(9):2019-31. doi: 10.1002/jcp.24998. J Cell Physiol. 2015. PMID: 25820299 Free PMC article. Review.
-
Expression of voltage-gated calcium channel α(2)δ(4) subunits in the mouse and rat retina.J Comp Neurol. 2013 Aug 1;521(11):2486-501. doi: 10.1002/cne.23294. J Comp Neurol. 2013. PMID: 23296739 Free PMC article.
-
Central Mechanisms Mediating Thrombospondin-4-induced Pain States.J Biol Chem. 2016 Jun 17;291(25):13335-48. doi: 10.1074/jbc.M116.723478. Epub 2016 Apr 19. J Biol Chem. 2016. PMID: 27129212 Free PMC article.
-
Suppression of pain-related behavior in two distinct rodent models of peripheral neuropathy by a homopolyarginine-conjugated CRMP2 peptide.J Neurochem. 2013 Mar;124(6):869-79. doi: 10.1111/jnc.12070. Epub 2013 Jan 20. J Neurochem. 2013. PMID: 23106100 Free PMC article.
-
Rab11-dependent recycling of calcium channels is mediated by auxiliary subunit α2δ-1 but not α2δ-3.Sci Rep. 2021 May 13;11(1):10256. doi: 10.1038/s41598-021-89820-1. Sci Rep. 2021. PMID: 33986433 Free PMC article.
References
-
- Annis DS, Gunderson KA, Mosher DF. Immunochemical analysis of the structure of the signature domains of thrombospondin-1 and thrombospondin-2 in low calcium concentrations. The Journal of biological chemistry. 2007;282:27067–27075. - PubMed
-
- Arikkath J, Campbell KP. Auxiliary subunits: essential components of the voltage-gated calcium channel complex. Current opinion in neurobiology. 2003;13:298–307. - PubMed
Publication types
MeSH terms
Substances
Grants and funding
- R01 DA015043-06/DA/NIDA NIH HHS/United States
- R01 DA015043-05/DA/NIDA NIH HHS/United States
- R37 DA015043/DA/NIDA NIH HHS/United States
- R01 HL049081-09/HL/NHLBI NIH HHS/United States
- R01 NS040135-05/NS/NINDS NIH HHS/United States
- R01 NS040135-02/NS/NINDS NIH HHS/United States
- R01 DA015043-09/DA/NIDA NIH HHS/United States
- R01 HL049081-07/HL/NHLBI NIH HHS/United States
- R21 DE014545-03/DE/NIDCR NIH HHS/United States
- R01 NS040135-04/NS/NINDS NIH HHS/United States
- R21 DE014545/DE/NIDCR NIH HHS/United States
- DA15043/DA/NIDA NIH HHS/United States
- R21 DE014545-02/DE/NIDCR NIH HHS/United States
- R01 DA015043/DA/NIDA NIH HHS/United States
- R01 DA015043-07/DA/NIDA NIH HHS/United States
- R01 HL049081/HL/NHLBI NIH HHS/United States
- DE14545/DE/NIDCR NIH HHS/United States
- R21 DE014545-01A1/DE/NIDCR NIH HHS/United States
- NS40135/NS/NINDS NIH HHS/United States
- R01 NS040135/NS/NINDS NIH HHS/United States
- R01 DA015043-08/DA/NIDA NIH HHS/United States
- R01 DA015043-03/DA/NIDA NIH HHS/United States
- R01 DA015043-04/DA/NIDA NIH HHS/United States
- HL49081/HL/NHLBI NIH HHS/United States
- R01 NS040135-03/NS/NINDS NIH HHS/United States
- R01 HL049081-08/HL/NHLBI NIH HHS/United States
- R01 NS040135-05S1/NS/NINDS NIH HHS/United States
LinkOut - more resources
Full Text Sources
Other Literature Sources
Molecular Biology Databases
Miscellaneous

