

Malignant cell-derived PlGF promotes normalization and remodeling of the tumor vasculature
- PMID: 19805167
- PMCID: PMC2752403
- DOI: 10.1073/pnas.0908026106
Malignant cell-derived PlGF promotes normalization and remodeling of the tumor vasculature
Abstract
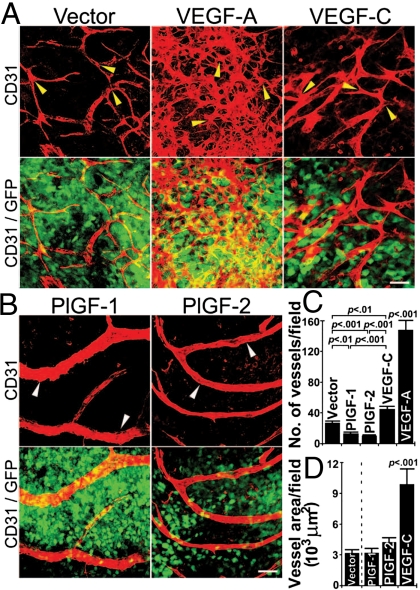
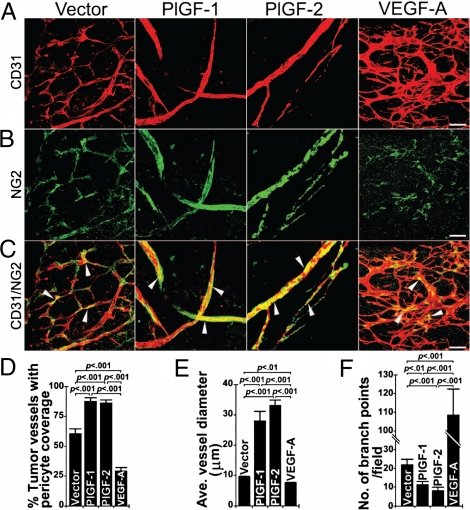
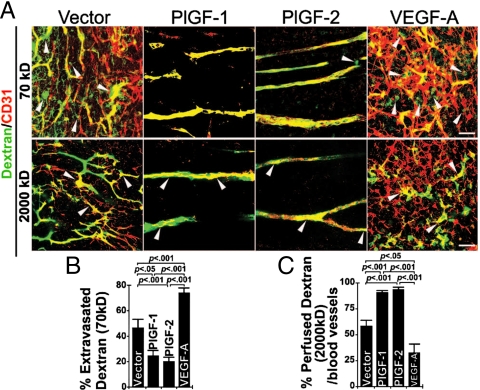
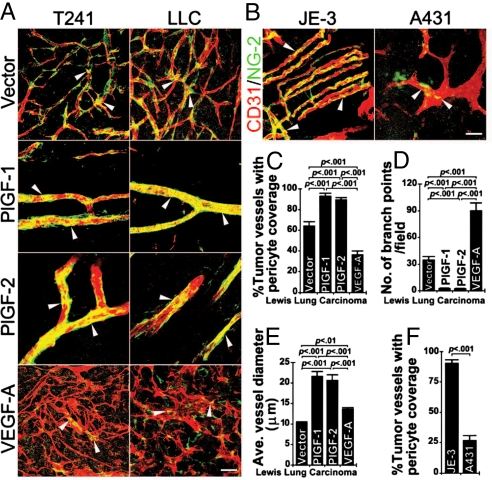
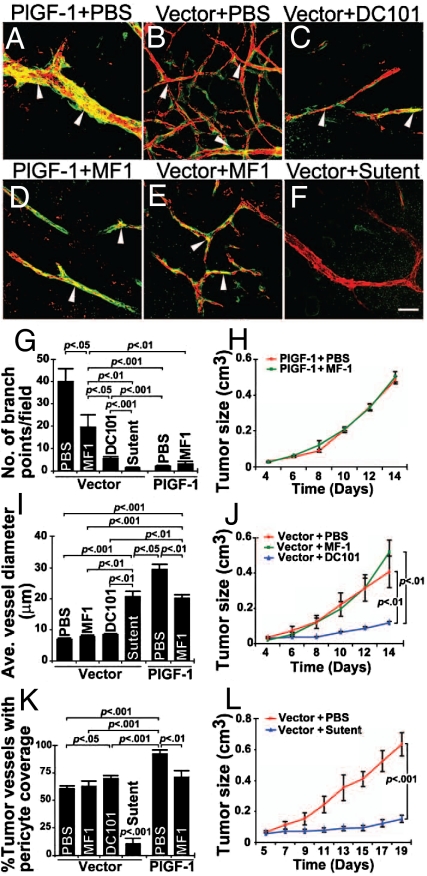
Vascular functions of PlGF remain poorly understood and controversial. Here, we show that tumor cell-derived PlGF-1 and PlGF-2 displayed significant remodeling effects on the tumor vasculature, leading to a normalized vascular phenotype and improved functions against leakage. In two murine tumor models, that is, T241 fibrosarcoma and Lewis lung carcinoma, stable expression of PlGF-1 and PlGF-2 in tumor cells resulted in significant reduction of tumor microvascular density and branch formation. Markedly, the vasculature in PlGF-expressing tumors consisted of relatively large-diameter microvessels with substantial improvement of pericyte coverage. Similarly, PlGF-induced vascular normalization and remodeling were also observed in a spontaneous human choriocarcinoma that expressed endogenous PlGF. Our findings shed light on functions of PlGF as a vascular remodeling factor that normalizes the tumor vasculature and thus may have conceptual implications of cancer therapy.
Conflict of interest statement
The authors declare no conflict of interest.
Figures
Similar articles
-
Vascular endothelial growth factor-dependent spatiotemporal dual roles of placental growth factor in modulation of angiogenesis and tumor growth.Proc Natl Acad Sci U S A. 2013 Aug 20;110(34):13932-7. doi: 10.1073/pnas.1309629110. Epub 2013 Aug 5. Proc Natl Acad Sci U S A. 2013. PMID: 23918367 Free PMC article.
-
Altered tumor vessel maturation and proliferation in placenta growth factor-producing tumors: potential relationship to post-therapy tumor angiogenesis and recurrence.Int J Cancer. 2003 Jun 10;105(2):158-64. doi: 10.1002/ijc.11059. Int J Cancer. 2003. PMID: 12673673
-
Placenta growth factor-1 antagonizes VEGF-induced angiogenesis and tumor growth by the formation of functionally inactive PlGF-1/VEGF heterodimers.Cancer Cell. 2002 Feb;1(1):99-108. doi: 10.1016/s1535-6108(02)00028-4. Cancer Cell. 2002. PMID: 12086892
-
Cancer-associated retinopathy: a new mechanistic insight on vascular remodeling.Cell Cycle. 2010 May 15;9(10):1882-5. doi: 10.4161/cc.9.10.11521. Epub 2010 May 15. Cell Cycle. 2010. PMID: 20473029 Review.
-
The placenta growth factor in skin angiogenesis.J Dermatol Sci. 2006 Jan;41(1):11-9. doi: 10.1016/j.jdermsci.2005.08.008. Epub 2005 Oct 10. J Dermatol Sci. 2006. PMID: 16216466 Review.
Cited by
-
Vascular endothelial growth factor-dependent spatiotemporal dual roles of placental growth factor in modulation of angiogenesis and tumor growth.Proc Natl Acad Sci U S A. 2013 Aug 20;110(34):13932-7. doi: 10.1073/pnas.1309629110. Epub 2013 Aug 5. Proc Natl Acad Sci U S A. 2013. PMID: 23918367 Free PMC article.
-
Distal-less 3 haploinsufficiency results in elevated placental oxidative stress and altered fetal growth kinetics in the mouse.Placenta. 2012 Oct;33(10):830-8. doi: 10.1016/j.placenta.2012.06.018. Epub 2012 Jul 19. Placenta. 2012. PMID: 22819041 Free PMC article.
-
Harnessing Induced Essentiality: Targeting Carbonic Anhydrase IX and Angiogenesis Reduces Lung Metastasis of Triple Negative Breast Cancer Xenografts.Cancers (Basel). 2019 Jul 17;11(7):1002. doi: 10.3390/cancers11071002. Cancers (Basel). 2019. PMID: 31319613 Free PMC article.
-
The antitumor efficacy of monomeric disintegrin obtustatin in S-180 sarcoma mouse model.Invest New Drugs. 2019 Oct;37(5):1044-1051. doi: 10.1007/s10637-019-00734-2. Epub 2019 Jan 25. Invest New Drugs. 2019. PMID: 30680583
-
Angiogenic cytokines and their influence on circulating tumour cells in sera of patients with the primary diagnosis of breast cancer before treatment.BMC Cancer. 2016 Jul 27;16:547. doi: 10.1186/s12885-016-2612-7. BMC Cancer. 2016. PMID: 27464822 Free PMC article. Clinical Trial.
References
-
- Cao Y, Zhong W, Sun Y. Improvement of antiangiogenic cancer therapy by understanding the mechanisms of angiogenic factor interplay and drug resistance. Semin Cancer Biol. 2009 - PubMed
-
- Carmeliet P. Angiogenesis in health and disease. Nat Med. 2003;9:653–660. - PubMed
-
- Ferrara N, Kerbel RS. Angiogenesis as a therapeutic target. Nature. 2005;438:967–974. - PubMed
-
- Folkman J. Angiogenesis: An organizing principle for drug discovery? Nat Rev Drug Discov. 2007;6:273–286. - PubMed
Publication types
MeSH terms
Substances
LinkOut - more resources
Full Text Sources
Other Literature Sources
Medical
Molecular Biology Databases
