Structural relationships among proteins with different global topologies and their implications for function annotation strategies
- PMID: 19805138
- PMCID: PMC2765090
- DOI: 10.1073/pnas.0907971106
Structural relationships among proteins with different global topologies and their implications for function annotation strategies
Abstract
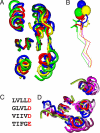
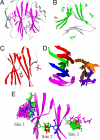
It has become increasingly apparent that geometric relationships often exist between regions of two proteins that have quite different global topologies or folds. In this article, we examine whether such relationships can be used to infer a functional connection between the two proteins in question. We find, by considering a number of examples involving metal and cation binding, sugar binding, and aromatic group binding, that geometrically similar protein fragments can share related functions, even if they have been classified as belonging to different folds and topologies. Thus, the use of classifications inevitably limits the number of functional inferences that can be obtained from the comparative analysis of protein structures. In contrast, the development of interactive computational tools that recognize the "continuous" nature of protein structure/function space, by increasing the number of potentially meaningful relationships that are considered, may offer a dramatic enhancement in the ability to extract information from protein structure databases. We introduce the MarkUs server, that embodies this strategy and that is designed for a user interested in developing and validating specific functional hypotheses.
Conflict of interest statement
The authors declare no conflict of interest.
Figures


Similar articles
-
Template-Based Prediction of Protein-Peptide Interactions by Using GalaxyPepDock.Methods Mol Biol. 2017;1561:37-47. doi: 10.1007/978-1-4939-6798-8_4. Methods Mol Biol. 2017. PMID: 28236232
-
Protein functional annotation by homology.Methods Mol Biol. 2008;484:465-90. doi: 10.1007/978-1-59745-398-1_28. Methods Mol Biol. 2008. PMID: 18592196
-
Structural motifs recurring in different folds recognize the same ligand fragments.BMC Bioinformatics. 2009 Jun 15;10:182. doi: 10.1186/1471-2105-10-182. BMC Bioinformatics. 2009. PMID: 19527512 Free PMC article.
-
NMR for the design of functional mimetics of protein-protein interactions: one key is in the building of bridges.Biochem Cell Biol. 1998;76(2-3):177-88. doi: 10.1139/bcb-76-2-3-177. Biochem Cell Biol. 1998. PMID: 9923687 Review.
-
Contemporary approaches to protein structure classification.Bioessays. 1998 Nov;20(11):884-91. doi: 10.1002/(SICI)1521-1878(199811)20:11<884::AID-BIES3>3.0.CO;2-H. Bioessays. 1998. PMID: 9872054 Review.
Cited by
-
Solution NMR structure of CD1104B from pathogenic Clostridium difficile reveals a distinct α-helical architecture and provides first structural representative of protein domain family PF14203.J Struct Funct Genomics. 2013 Dec;14(4):155-60. doi: 10.1007/s10969-013-9164-8. Epub 2013 Sep 19. J Struct Funct Genomics. 2013. PMID: 24048810 Free PMC article.
-
Is protein classification necessary? Toward alternative approaches to function annotation.Curr Opin Struct Biol. 2009 Jun;19(3):363-8. doi: 10.1016/j.sbi.2009.02.001. Epub 2009 Mar 5. Curr Opin Struct Biol. 2009. PMID: 19269161 Free PMC article. Review.
-
Structure-based systems biology for analyzing off-target binding.Curr Opin Struct Biol. 2011 Apr;21(2):189-99. doi: 10.1016/j.sbi.2011.01.004. Epub 2011 Feb 1. Curr Opin Struct Biol. 2011. PMID: 21292475 Free PMC article. Review.
-
Complex evolutionary footprints revealed in an analysis of reused protein segments of diverse lengths.Proc Natl Acad Sci U S A. 2017 Oct 31;114(44):11703-11708. doi: 10.1073/pnas.1707642114. Epub 2017 Oct 19. Proc Natl Acad Sci U S A. 2017. PMID: 29078314 Free PMC article.
-
Molecular mechanisms involved in the side effects of fatty acid amide hydrolase inhibitors: a structural phenomics approach to proteome-wide cellular off-target deconvolution and disease association.NPJ Syst Biol Appl. 2016 Nov 10;2:16023. doi: 10.1038/npjsba.2016.23. eCollection 2016. NPJ Syst Biol Appl. 2016. PMID: 28725477 Free PMC article.
References
-
- Yang AS, Honig B. An integrated approach to the analysis and modeling of protein sequences and structures. I. Protein structural alignment and a quantitative measure for protein structural distance. J Mol Biol. 2000;301:665–678. - PubMed
-
- Shindyalov IN, Bourne PE. An alternative view of protein fold space. Prot: Struct Func Gen. 2000;38:247–260. - PubMed
-
- Kihara D, Skolnick J. The PDB is a covering set of small protein structures. J Mol Biol. 2003;334:793–802. - PubMed
-
- Szustakowski JD, Kasif S, Weng Z. Less is more: Towards an optimal universal description of protein folds. Bioinformatics. 2005;21:ii66–71. - PubMed
-
- Friedberg I, Godzik A. Connecting the protein structure universe by using sparse recurring fragments. Structure. 2005;13:1213–1224. - PubMed
Publication types
MeSH terms
Substances
Grants and funding
LinkOut - more resources
Full Text Sources
Other Literature Sources

