Microenvironmental pH is a key factor for exosome traffic in tumor cells
- PMID: 19801663
- PMCID: PMC2797191
- DOI: 10.1074/jbc.M109.041152
Microenvironmental pH is a key factor for exosome traffic in tumor cells
Abstract
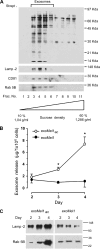
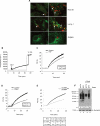
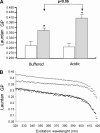
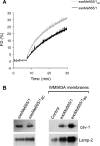
Exosomes secreted by normal and cancer cells carry and deliver a variety of molecules. To date, mechanisms referring to tumor exosome trafficking, including release and cell-cell transmission, have not been described. To gain insight into this, exosomes purified from metastatic melanoma cell medium were labeled with a lipid fluorescent probe, R18, and analyzed by spectrofluorometry and confocal microscopy. A low pH condition is a hallmark of tumor malignancy, potentially influencing exosome release and uptake by cancer cells. Using different pH conditions as a modifier of exosome traffic, we showed (i) an increased exosome release and uptake at low pH when compared with a buffered condition and (ii) exosome uptake by melanoma cells occurred by fusion. Membrane biophysical analysis, such as fluidity and lipid composition, indicated a high rigidity and sphingomyelin/ganglioside GM3 (N-acetylneuraminylgalactosylglucosylceramide) content in exosomes released at low pH. This was likely responsible for the increased fusion efficiency. Consistent with these results, pretreatment with proton pump inhibitors led to an inhibition of exosome uptake by melanoma cells. Fusion efficiency of tumor exosomes resulted in being higher in cells of metastatic origin than in those derived from primary tumors or normal cells. Furthermore, we found that caveolin-1, a protein involved in melanoma progression, is highly delivered through exosomes released in an acidic condition. The results of our study provide the evidence that exosomes may be used as a delivery system for paracrine diffusion of tumor malignancy, in turn supporting the importance of both exosomes and tumor pH as key targets for future anti-cancer strategies.
Figures


Similar articles
-
Acidic microenvironment plays a key role in human melanoma progression through a sustained exosome mediated transfer of clinically relevant metastatic molecules.J Exp Clin Cancer Res. 2018 Oct 5;37(1):245. doi: 10.1186/s13046-018-0915-z. J Exp Clin Cancer Res. 2018. PMID: 30290833 Free PMC article.
-
Exosome release and low pH belong to a framework of resistance of human melanoma cells to cisplatin.PLoS One. 2014 Feb 6;9(2):e88193. doi: 10.1371/journal.pone.0088193. eCollection 2014. PLoS One. 2014. PMID: 24516610 Free PMC article.
-
The role of exosomes in metastasis and progression of melanoma.Cancer Treat Rev. 2020 Apr;85:101975. doi: 10.1016/j.ctrv.2020.101975. Epub 2020 Jan 22. Cancer Treat Rev. 2020. PMID: 32050108 Review.
-
Melanoma cell-derived exosomes promote epithelial-mesenchymal transition in primary melanocytes through paracrine/autocrine signaling in the tumor microenvironment.Cancer Lett. 2016 Jul 1;376(2):318-27. doi: 10.1016/j.canlet.2016.03.050. Epub 2016 Apr 7. Cancer Lett. 2016. PMID: 27063098 Free PMC article.
-
Signaling of Tumor-Derived sEV Impacts Melanoma Progression.Int J Mol Sci. 2020 Jul 17;21(14):5066. doi: 10.3390/ijms21145066. Int J Mol Sci. 2020. PMID: 32709086 Free PMC article. Review.
Cited by
-
Illuminating the Molecular Intricacies of Exosomes and ncRNAs in Cardiovascular Diseases: Prospective Therapeutic and Biomarker Potential.Cells. 2022 Nov 18;11(22):3664. doi: 10.3390/cells11223664. Cells. 2022. PMID: 36429092 Free PMC article. Review.
-
Advances in the discovery of exosome inhibitors in cancer.J Enzyme Inhib Med Chem. 2020 Dec;35(1):1322-1330. doi: 10.1080/14756366.2020.1754814. J Enzyme Inhib Med Chem. 2020. PMID: 32543905 Free PMC article. Review.
-
Proteostatic imbalance and protein spreading in amyotrophic lateral sclerosis.EMBO J. 2021 May 17;40(10):e106389. doi: 10.15252/embj.2020106389. Epub 2021 Mar 31. EMBO J. 2021. PMID: 33792056 Free PMC article. Review.
-
The updated landscape of tumor microenvironment and drug repurposing.Signal Transduct Target Ther. 2020 Aug 25;5(1):166. doi: 10.1038/s41392-020-00280-x. Signal Transduct Target Ther. 2020. PMID: 32843638 Free PMC article. Review.
-
Extracellular vesicles: Roles and applications in drug-induced liver injury.Adv Clin Chem. 2021;102:63-125. doi: 10.1016/bs.acc.2020.08.010. Epub 2020 Oct 1. Adv Clin Chem. 2021. PMID: 34044913 Free PMC article. Review.
References
-
- Huber V., Fais S., Iero M., Lugini L., Canese P., Squarcina P., Zaccheddu A., Colone M., Arancia G., Gentile M., Seregni E., Valenti R., Ballabio G., Belli F., Leo E., Parmiani G., Rivoltini L. (2005) Gastroenterology 128, 1796–1804 - PubMed
-
- Valenti R., Huber V., Filipazzi P., Pilla L., Sovena G., Villa A., Corbelli A., Fais S., Parmiani G., Rivoltini L. (2006) Cancer Res. 66, 9290–9298 - PubMed
-
- Bard M. P., Hegmans J. P., Hemmes A., Luider T. M., Willemsen R., Severijnen L. A., van Meerbeeck J. P., Burgers S. A., Hoogsteden H. C., Lambrecht B. N. (2004) Am. J. Respir. Cell Mol. Biol. 31, 114–121 - PubMed
-
- Calzolari A., Raggi C., Deaglio S., Sposi N. M., Stafsnes M., Fecchi K., Parolini I., Malavasi F., Peschle C., Sargiacomo M., Testa U. (2006) J. Cell Sci. 119, 4486–4498 - PubMed
Publication types
MeSH terms
Substances
LinkOut - more resources
Full Text Sources
Other Literature Sources
Medical
Miscellaneous

