. 2009 Sep 29;4(9):e7163.
doi: 10.1371/journal.pone.0007163.

Sustained oscillations of NF-kappaB produce distinct genome scanning and gene expression profiles

Affiliations

Sustained oscillations of NF-kappaB produce distinct genome scanning and gene expression profiles

Myong-Hee Sung et al. PLoS One. .

Abstract

NF-kappaB is a prototypic stress-responsive transcription factor that acts within a complex regulatory network. The signaling dynamics of endogenous NF-kappaB in single cells remain poorly understood. To examine real time dynamics in living cells, we monitored NF-kappaB activities at multiple timescales using GFP-p65 knock-in mouse embryonic fibroblasts. Oscillations in NF-kappaB were sustained in most cells, with several cycles of transient nuclear translocation after TNF-alpha stimulation. Mathematical modeling suggests that NF-kappaB oscillations are selected over other non-oscillatory dynamics by fine-tuning the relative strengths of feedback loops like IkappaBalpha. The ability of NF-kappaB to scan and interact with the genome in vivo remained remarkably constant from early to late cycles, as observed by fluorescence recovery after photobleaching (FRAP). Perturbation of long-term NF-kappaB oscillations interfered with its short-term interaction with chromatin and balanced transcriptional output, as predicted by the mathematical model. We propose that negative feedback loops do not simply terminate signaling, but rather promote oscillations of NF-kappaB in the nucleus, and these oscillations are functionally advantageous.


Conflict of interest statement

Competing Interests: The authors have declared that no competing interests exist.

Figures

Figure 1
Figure 1. Real time monitoring of GFP-p65 using GFP knock-in MEF and live cell microscopy allows accurate quantification of single cell dynamics of endogenous p65.
(A) The population average time course of nuclear NF-κB (red) can show strongly damped oscillation even when the individual cells (black, 20 out of 1000 shown) have sustained oscillatory dynamics. Thousand hypothetical sine waves were generated to have a period slightly varying from 2 hours (15% S.D. in cycle frequency) and linearly decreasing amplitude. The late peaks become unsynchronized, making the average profile appear constant. (B) The knock-in mice have the endogenous p65 locus replaced by GFP-p65 and have wild-type phenotype. (C) A typical time series of a single living cell treated with 10 ng/ml TNF-α and imaged overnight. The low GFP level required special image acquisition setup. The quantification of the GFP intensity data is shown in the time course plot in (D). (D) The time lapse image analysis procedure is shown schematically. The nuclear:total ratio of GFP-p65 plotted is for the cell in (C), where the labeled arrows correspond to the images. The ratio was obtained as the mean nuclear intensity divided by mean cellular intensity (see Methods). The periodogram on right has a single sharp peak and indicates that the estimated period is ∼1.5 hours for this cell.
Figure 2
Figure 2. Periodic cycles in TNF-α induced NF-κB oscillations are sustained in most cells.
(A) 79% of the cells (n = 95) had sustained oscillations in nuclear p65. Ten temporal profiles from TNF-α treated cells are shown, with eight oscillating (left 4 columns) and two non-oscillating (last column) cells. The lower panel is from control time lapse data where cells were followed by time lapse microscopy without TNF-α treatment. The red line at ratio 1 indicates the state where the nuclear and the total mean intensities are the same. (B) The distribution of the period identified by Fourier analysis (see Methods).
Figure 3
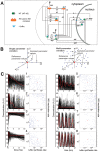
Figure 3. Computer simulations suggest that NF-κB dynamic profiles are mostly controlled by kinetic parameters for negative feedback.
(A) A schematic representation of an NF-κB model. It includes essential regulatory events such as IKK activation, inducible/constitutive degradation of IκBα, nuclear import/export, inducible synthesis of IκBα, and post-stimulus attenuation of IKK activity. The quantitative model is described in full by the differential equations in Fig. S2A. (B) Two different approaches for parameter variation. Unlike single parameter variation, where one parameter is varied at a time from the reference value and the rest are fixed (top), we varied all parameter values simultaneously in a random fashion (bottom). (C) The dynamical model was numerically solved for a random sample of 1000 parameter combinations. Each kinetic parameter was varied by two orders of magnitude around the reference value (see Supplementary Information). From the simulated temporal profiles eight dominant patterns were extracted by K-means cluster analysis (K = 8). For each cluster, individual time courses of free nuclear p65 are shown in black, and a representative profile is in red. The underlying system parameter values (s, neg) that correspond to the simulations within the given cluster are presented to the right of each cluster plot. Only the two most influential parameters are plotted out of 18 co-varied parameters. The red dot indicates the reference parameter values.
Figure 4
Figure 4. Two contrasting perturbations of NF-κB oscillations decouple nucleocytoplasmic shuttling from feedback-driven long-term dynamics.
(A) Perturbed dynamics were simulated using the model in Fig. 3 and the parameter values from clusters 5, 7, and 8, with the additional modifications to nuclear export terms or the induced IκBα synthesis term for LMB or CHX effects, respectively (see text). The graphs show the time courses of free, IκBα-complexed, and total p65 in the nucleus, as predicted by the model. The red curves indicate the free and complexed components of a typical profile of nuclear p65. Inhibition of nuclear export allows one cycle of free p65 whereas inhibition of negative feedback induces constant activity. (B) Experimentally observed time lapse profiles of nuclear p65 level for single cells co-treated with LMB or CHX. Cells were treated with 10 ng/ml TNF-α and either 5 nM LMB or 2.5 µg/ml CHX, and followed by live cell imaging. (C) Nuclear export of free p65 was simulated using the model in Fig. 3 with the parameter values from clusters 5, 7, and 8, and s was reduced by 100-fold at t = 0 for the CHX effect. In addition, nuclear import parameters (iNF, iI) were reduced to 10−5 at t = 90 min after TNF-α and CHX co-treatment. The total nuclear p65 amount (which is close to the free p65 amount under this condition) is shown in the upper panel. The first 10 minute interval after inhibition of import is plotted on the expanded time axis on the right, to facilitate comparison to the experimentally measured time course in (D). (D) Fluorescence loss in photobleaching (FLIP) was performed to determine any ongoing exchange of p65 between the nucleus and the cytoplasm after its apparently complete nuclear translocation induced by TNF-α alone or in co-treatment with CHX or LMB. A circular spot in the cytoplasm was repeatedly bleached for 10 minutes while the nuclear mean intensity was monitored (inset). The relatively short timeframe for the FLIP protocol did not allow measurements up to complete loss of GFP signal. Error bars are S.E.
Figure 5
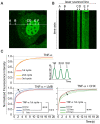
Figure 5. Perturbations of NF-κB oscillations by inhibiting either shuttling or IκBα re-synthesis cause opposite defects in characteristic genome-scanning activity of p65.
(A) The line FRAP protocol. The line FRAP assay allowed photodamage-free in vivo analysis of the dim cells by limiting the laser scan area to a line. The white line is the scanning path of the confocal microscope. Segment EF represents the bleaching region (5 µm). Segment AB represents the background while CD is used to correct for the bleaching during imaging in the double normalization procedure (see Methods). This example shows a GFP-p65 knock-in cell co-treated with TNF-α and CHX for 2.5 hrs. In this condition, p65 mobility is the lowest (see panel B). (B) This image represents the line FRAP output from the cell in (A). The x axis is the laser scanning path. Each repetition of the line scanning appears as a line along the time axis. The bleached region is visible as a solid green rectangle. The dark area below the bleached region is indicative of the slow recovery. (C) Line FRAP experiments were performed at the specified times on cells treated with TNF-α (top panel) and on cells co-treated with TNF-α and LMB or CHX (bottom left and right panels). The recovery curves represent fitting of the raw data by bi-exponential curves and *** indicates a statistically significant difference (p<0.001) according to a permutation test (see Methods). The reference profile for all comparisons was that from the first p65 cycle after TNF-α (red curve, top panel). The arrows indicate the shift of the curves over time.
Figure 6
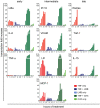
Figure 6. TNF-α induced gene expression programs are quantitatively modulated by perturbations of NF-κB dynamics that alter the number of signaling cycles or peak durations.
Gene expression profiles were measured by q-PCR in cells stimulated as specified in the bottom right panel. RNA samples were prepared at half-hour intervals up to 3 hrs after stimulation as indicated on the time axis. Time-points for LMB- and CHX- only controls were up to 1.5 hrs.
Figure 7
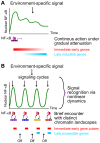
Figure 7. Fine-tuning transcriptional output by NF-κB oscillations.
(A) When there are little or no NF-κB oscillations, immediately accessible target genes are continuously induced. Gene-specific mechanisms attenuate the transcription of these genes over time, while a different group of genes become responsive. In this model, overall gene expression kinetics does not critically depend on NF-κB dynamics. (B) Sustained NF-κB oscillations allow only pulses of expression for the immediate early genes, as the transcription factor interacts transiently with the chromatin at discrete times. In later signaling cycles, NF-κB returns with characteristic genome-scanning competency and acts on late-accessible genes, without having accumulated early transcripts at a high level. Therefore, NF-κB oscillations, which are strongly coupled with upstream signaling kinetics, ensure balanced gene expression programs.

Similar articles

Cited by

References

    1. Hoffmann A, Levchenko A, Scott ML, Baltimore D. The IkappaB-NF-kappaB signaling module: temporal control and selective gene activation. Science. 2002;298:1241–1245. - PubMed
    1. Geva-Zatorsky N, Rosenfeld N, Itzkovitz S, Milo R, Sigal A, et al. Oscillations and variability in the p53 system. Mol Syst Biol. 2006;2:2006 0033. - PMC - PubMed
    1. Nelson DE, Ihekwaba AE, Elliott M, Johnson JR, Gibney CA, et al. Oscillations in NF-kappaB signaling control the dynamics of gene expression. Science. 2004;306:704–708. - PubMed
    1. Hayden MS, Ghosh S. Shared principles in NF-kappaB signaling. Cell. 2008;132:344–362. - PubMed
    1. Cheong R, Bergmann A, Werner SL, Regal J, Hoffmann A, et al. Transient IkappaB kinase activity mediates temporal NF-kappaB dynamics in response to a wide range of tumor necrosis factor-alpha doses. J Biol Chem. 2006;281:2945–2950. - PubMed

Publication types